HPCC Systems Logs in the Cloud – Updated 26th Oct 2021

Rodrigo Pastrana, (Architect, LexisNexis Risk Solutions Group) has been a member of the HPCC Systems core technology team for nine years and a member of the LexisNexis Risk Solutions Group team for just over a decade. Rodrigo focuses on platform integration and plug-in development. He is the principle developer of WsSQL, the HPCC Systems JDBC connector, the HPCC Systems Java APIs library and tools, the Spark-HPCC plugin and connector, and the Dynamic ESDL component. He has close to twenty years of experience in design, research and development of state of the art technology including IBM’s embedded text-to-speech and voice recognition products and Eclipse’s device development environment. Rodrigo holds an MS and BS in Computer Engineering from the University of Florida and during his professional career has filed more than ten patent disclosures through the USPTO.
Updated 26th October 2021 – Enhancements included in HPCC Systems 8.4.x
Log visualizations help identify, track and predict important events and trends on HPCC Systems clusters, by spotting interesting patterns and giving you visual clues which are easier to interpret than reading through the log file itself. Log visualization integration with ECL Watch using ELK (ElasticSearch, Logstash and Kibana) has been available using our bare metal HPCC Systems Platform since HPCC Systems 7.x.x, and you can find out more about it by reading about HPCC Systems log visualizations using ELK, by Rodrigo Pastrana.
In this blog, Rodrigo expands on this feature, focusing on a simple mechanism to process Cloud Native HPCC Systems platform component-level logs via Elastic Stack.
As HPCC Systems® continues its journey to the cloud, new challenges are presented by the containerized mode of operation. One major challenge is persistence and the availability of application-level logs. Following the most widely accepted containerized methodologies, HPCC Systems component log information is routed to the standard output streams rather than local files, as in previous versions of HPCC Systems. In a Kubernetes environment, the Docker container engine redirects the streams to a logging driver, which Kubernetes configures to write to a file in JSON format and those logs are exposed by Kubernetes via the aptly named logs command. Although the logs are temporarily available, they can be difficult to analyze and monitor in this format. It is also important to understand that these logs are ephemeral in nature and may be lost if the pod is evicted, the container crashes, the node dies, etc.
Update – Starting in HPCC Systems 8.4.0 elastich4cclogs has been enhanced to automate some of the steps required to view log data on Kibana, as well as providing HPCC Systems log query performance improvements and fine-grained query capabilities.
A Simple Solution
This feature provides casual users a lightweight, yet complete log-processing solution and minimizes the steps previously requiring manual intervention. This feature provides a managed Helm chart which utilizes the Elastic Stack Helm charts for Elastic Search, Filebeats and Kibana.
Deployed Elastic Stack Components
The managed Elastic Stack instance is comprised of several components which work together, in this case, to persist and expose the HPCC Systems component logs.
- Filebeat – Harvests the log entries of interest, aggregates metadata information and forwards to a target index within the local Elastic Search.
- Elastic Search – Provides persistence, indexing, and querying capabilities.
Note: The Elasticsearch chart will declare a Permanent Volume Claim (PVC), which is used to persist data related to its indexes and indirectly, the HPCC Component logs. The PVCs by nature can outlive the HPCC Systems and Elastic deployments. It is up to you to manage the PVC appropriately, which includes deleting the PVC(s) when they are no longer needed. - Kibana – Provides a very useful UI layer which allows users to explore, query, and visualize the log data. More information is available in the official Kibana Guide.
Getting Started
Installing the Helm chart
The elastic4hpcclogs chart can be found in the HPCC Systems Helm repository.
To fetch and deploy the HPCC Systems managed charts, add the the hpcc Helm repository if you haven’t done so already:
helm repo add hpcc https://hpcc-systems.github.io/helm-chart/
Once this command has completed successfully, elastic4hpcclogs chart will be accessible locally.
Deploying Elastic Search and Kibana in the same context as your HPCC Systems cluster
Install the charts using the following command:
helm install myelk hpcc/elastic4hpcclogs
On completion, the following message is displayed:
Thank you for installing elastic4hpcclogs.
A lightweight Elastic Search instance for HPCC component log processing.

This deployment varies slightly from defaults set by Elastic, please review the
effective values.

PLEASE NOTE: Elastic Search declares PVC(s) which might require explicit manual
removal when no longer needed.
- NOTE: Depending on the version of Kubernetes, users might be warned about deprecated APIs in the Elastic charts (ClusterRole and ClusterRoleBinding are deprecated in v1.17+). Deployments based on Kubernetes < v1.22 should not be impacted.
Confirming the Elastic pods are ready
To do this, use the following command:
kubectl get pods
Which displays the following information showing the running pods:
...
elasticsearch-master-0                    1/1     Running            0
myelk-filebeat-6wd2g                      1/1     Running            0
myelk-kibana-68688b4d4d-d489b             1/1     Running            0
...
Confirming the Elastic services are ready
To do this, use the following command:
$ kubectl get svc
Which displays the following confirmation information:
...
elasticsearch-master            ClusterIP      10.109.50.54    <none>        9200/TCP,9300/TCP   68m
elasticsearch-master-headless   ClusterIP      None            <none>        9200/TCP,9300/TCP   68m
myelk-kibana                    LoadBalancer   10.110.129.199  localhost     5601:31465/TCP      68m
...
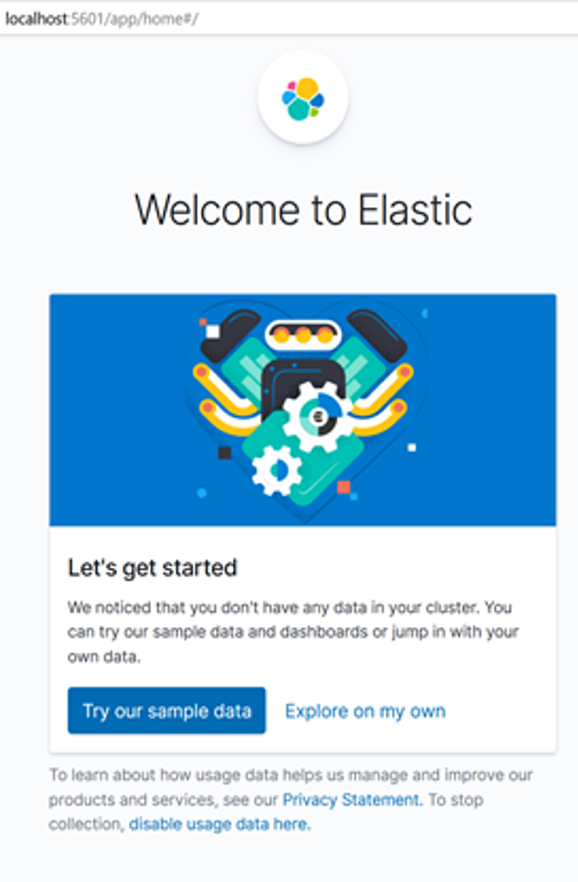
Confirming the Kibana Service is Accessible
To do this, direct your browser to the external address and port assigned to the service and the following screen will be displayed:
Viewing HPCC Systems Component Logs Via Kibana
Once enabled and running, it is possible to explore and query HPCC Systems component logs from the Kibana UI interface. Kibana index patterns are required to explore Elastic Search data from the Kibana user interface. Elastic4hpcclogs creates a default index pattern for HPCC Systems logs discovery called “filebeats*”
Discovering Log Data
- Navigate to the Discover section by selecting the Hamburger Icon, then Kibana, then Discover
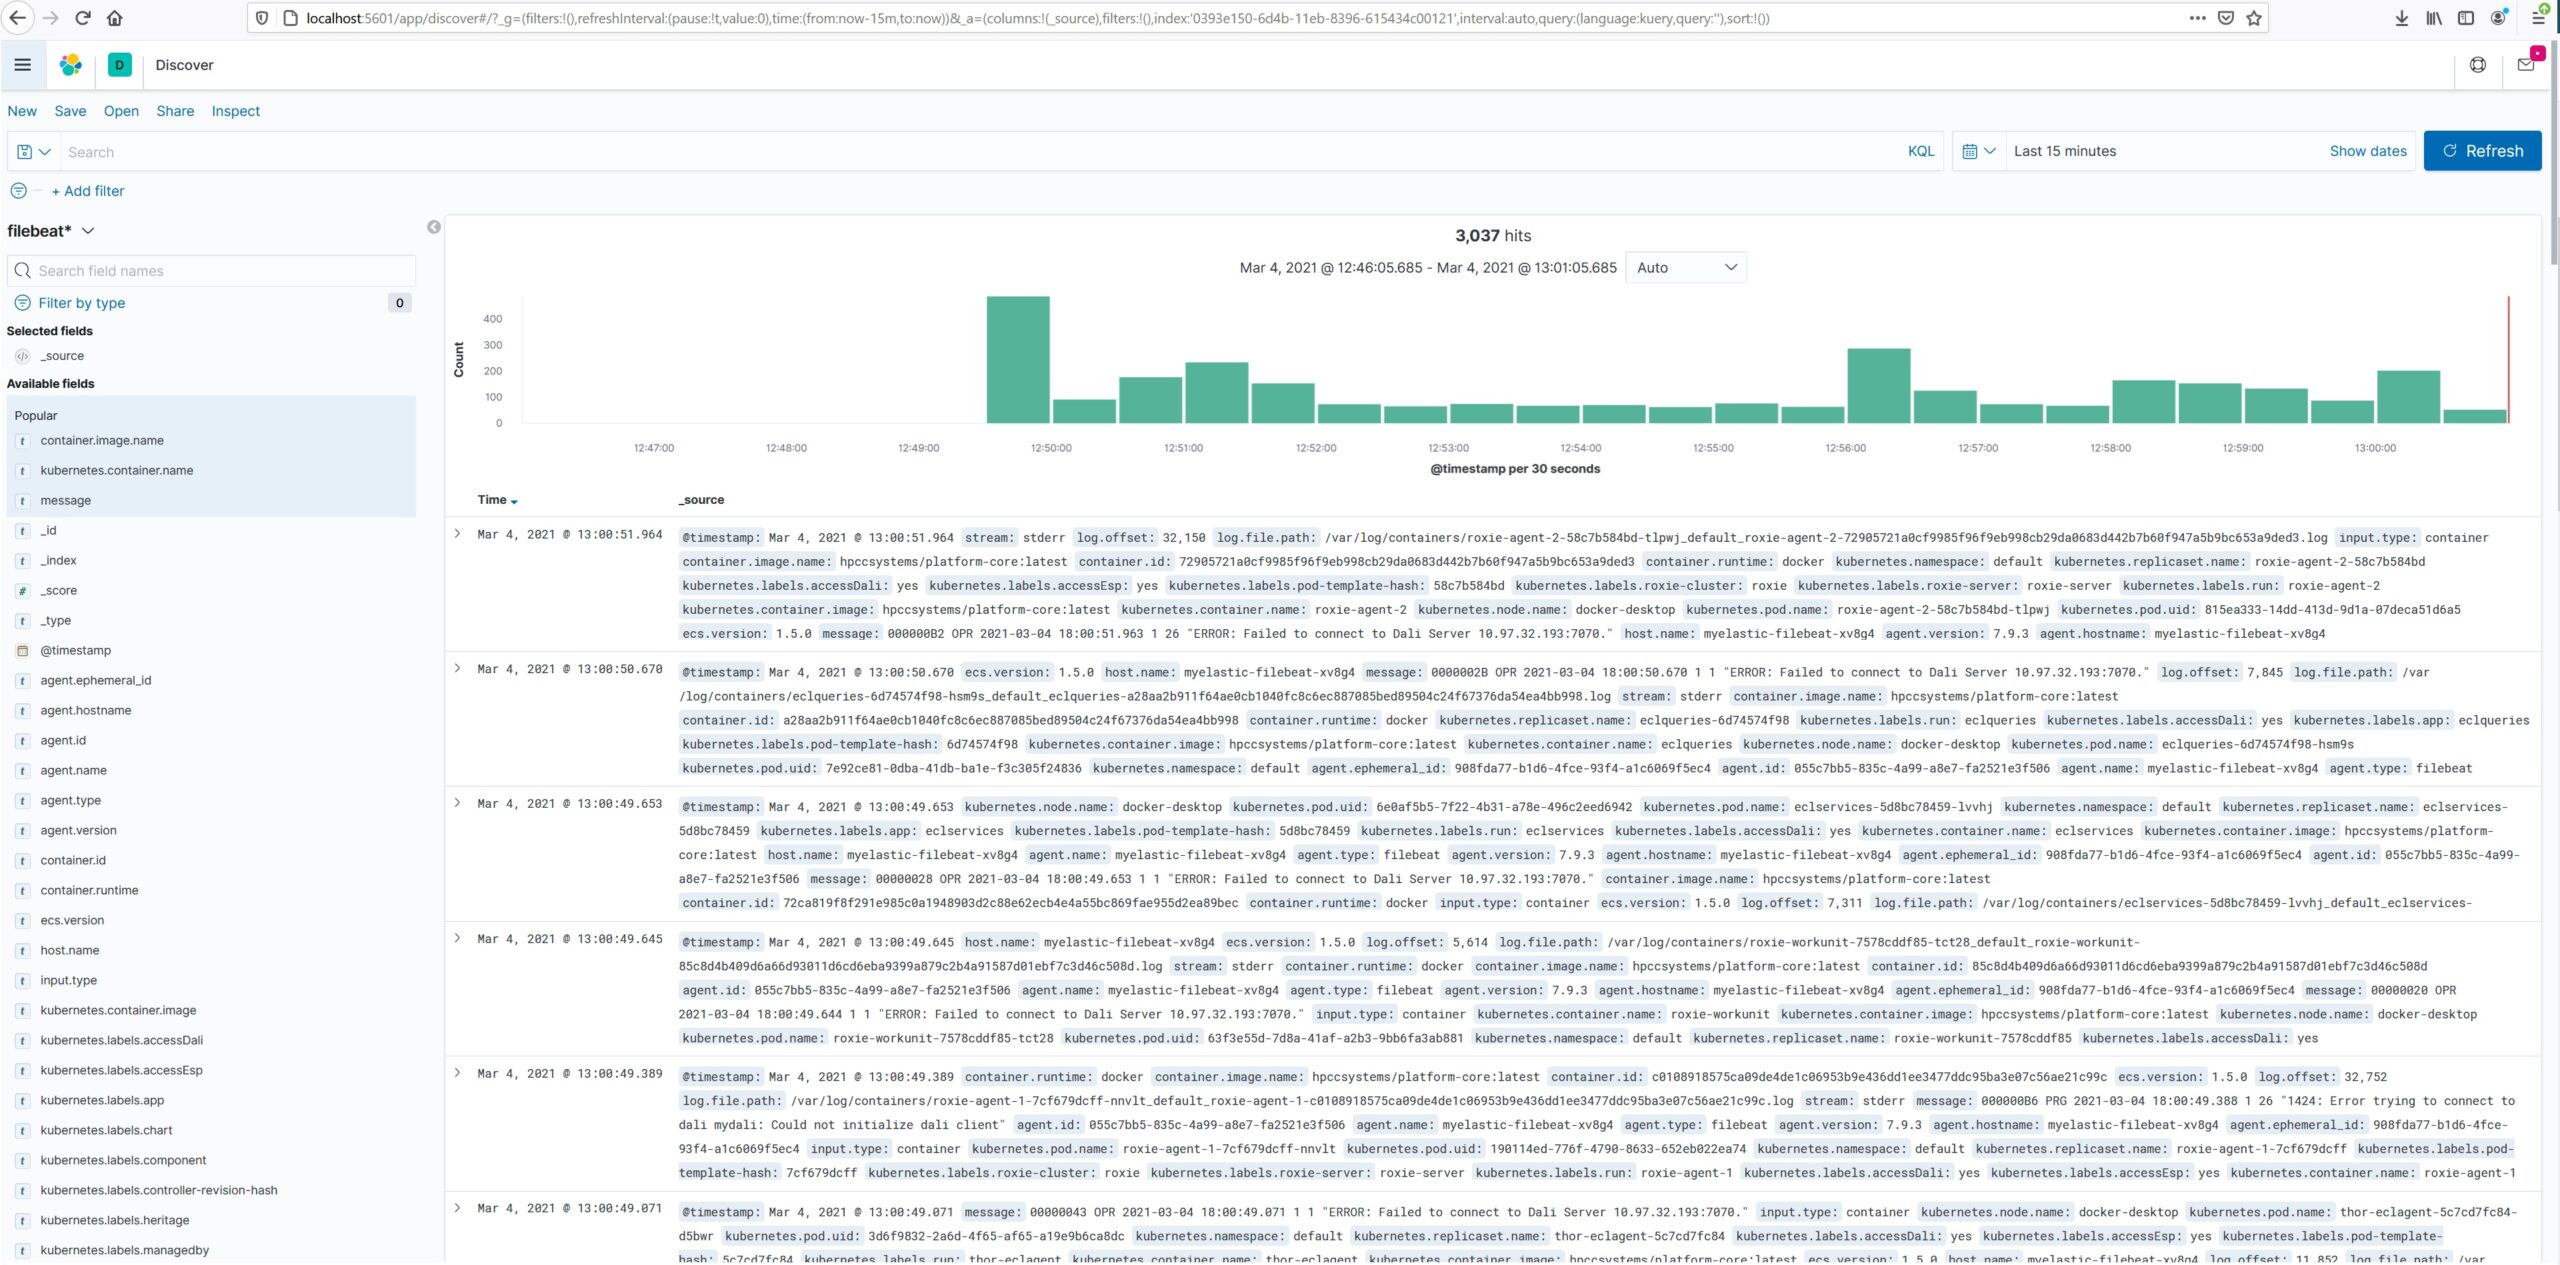
- Select filebeat* as the Index Pattern
- From the Discover section, select filebeat* from the index pattern drop-down list.
The following screen is displayed:
Filtering Out Noise
The filebeat* index pattern may contain many entries, possibly many of little interest. Even those entries which are of interest may contain many metadata columns of little or repetitive information.
At this point, you could simply dive in and perform free hand queries in the query bar provided at the top of the Discover section. The query bar accepts Kibana’s standard query language (KQL), which boasts a simple and flexible syntax and even attempts to provide auto complete guidance.
Updated – Building Filter Conditions Based on Container Name
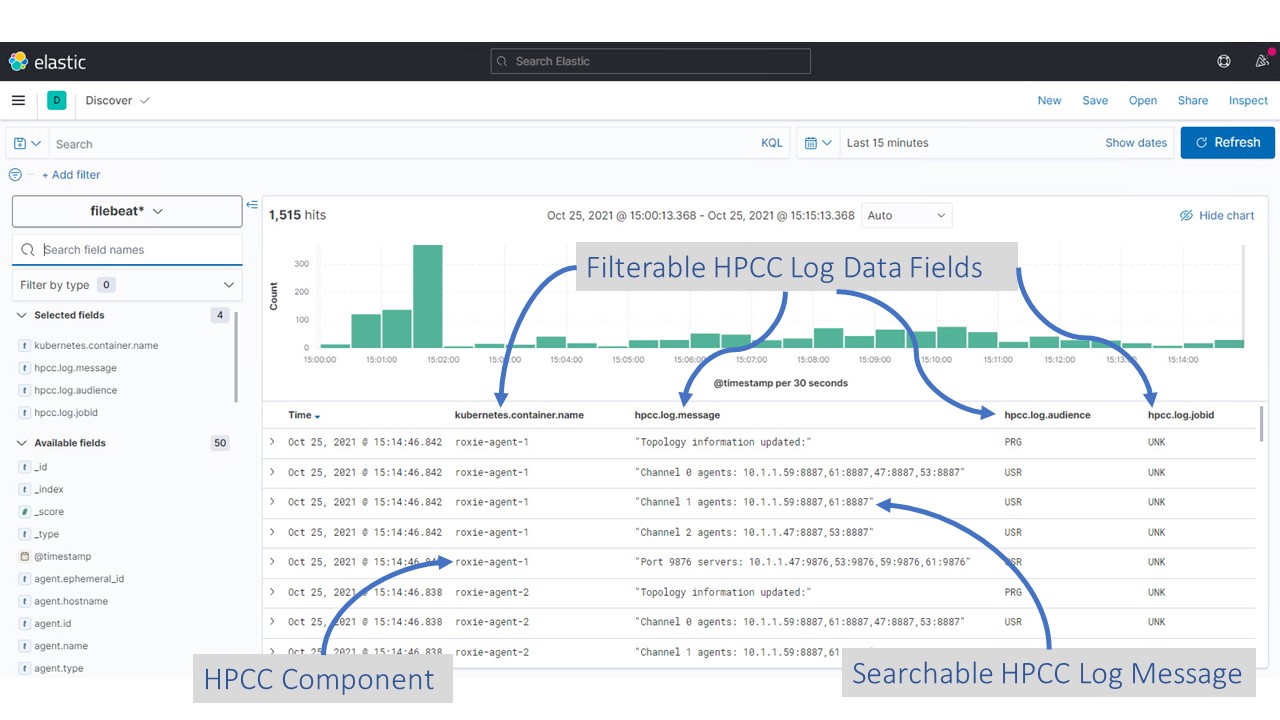
From the left panel you can choose the columns of interest and specific filters conditions, for example:
- Adding HPCC Systems Specific Log Content- From the available list on the left panel, hover over any HPCC.log.* prefixed entry and click the Add button. HPCC Systems component log messages should now be visible
- Adding a Source HPCC Systems Component Name Column. This allows you to group the log entries by HPCC Systems component. One way to accomplish this, is by adding the kubernetes.container.name column. From the available list on the left panel, hover over the kubernetes.container.name entry and click the Add button. The source HPCC Systems component names should now be visible.
Configuration of Elastic Stack Components
You may need or want to customise the Elastic stack components. The Elastic component charts values can be overridden as part of the HPCC System deployment command, for example:
helm install myelk hpcc/elastic4hpcclogs --set elasticsearch.minimumMasterNodes=2 --set elasticsearch.replicas=2
See the Elastic Stack GitHub repository for the complete list of all Filebeat, Elastic Search, LogStash and Kibana options with descriptions.
Celebrating 10 Years of the HPCC Systems Open Source Project
June 15, 2021 marks the 10th anniversary of HPCC Systems as an open source offering in the big data analytics market. Our 10 Year Anniversary Podcast Series showcases members of our HPCC Systems Community commemorating this milestone event.
Rodrigo Pastrana is featured in the video below, alongside our LexisNexis Risk Solutions Group colleague James McMullan (Sr Software Engineer). Both Rodrigo and James have developed many connectors and plugins for working with datasets using other open source projects. Their work has not only helped expand our ecosystem, but has also opened the door to new opportunities for creating additional interfaces to accommodate any data size or format.
Find out about these connectors, plugins and plans for the future as the HPCC Systems Platform becomes cloud native.
Click the image to watch the video hosted on the HPCC Systems YouTube Channel.
See more videos in this series by visiting our 10 Year Anniversary Podcast Series Wiki.