
Investigating Roxie Query Performance
As the query engine in the HPCC Systems® data lake platform, Roxie unlocks the true value of the platform by quickly completing user data queries to help users gain a better understanding of their data.
But as data lakes can hold truly massive amounts of data (the largest HPCC data lakes are estimated at 100 TB), queries can take a considerable amount of time to complete if they involve numerous different data sets. Accordingly, the development team here at HPCC Systems is constantly working to improve Roxie query performance to reduce the amount of time required for completion. This blog, the first in a two part series, examines different aspects of Roxie performance, including where to find information on query performance and how queries perform when retrieving data from a disk. The second blog will cover the latest developments to Roxie that improve its query performance, as well as plans for future enhancements to Roxie.
Identifying How Time Is Spent During Roxie Queries
The challenge with accelerating Roxie queries is the fact that no two queries are exactly alike. Some are simple and sequential; others are highly parallel. Some queries may spend most of their time retrieving data, or calling other services, or performing calculations, or joining data together. How do you find out where the time is going in your query? In the past, the best was to look at the summary lines that Roxie generates in its log files. That sounds simple, but it’s difficult to gather the logs to examine the information within, particularly when those logs are stored in the cloud.
Recent improvements to Roxie can provide that summary information along with the query results. The summary information is available when using testsocket or ECLWatch. The example below shows the extra option if you are using testsocket:
$ testsocket . "<stresstext_1 summaryStats='1'/>"

<Dataset name='Result 1'><Row><Result_1>true</Result_1></Row></Dataset>
<Dataset name='Result 2'><Row><Result_2>Done</Result_2></Row></Dataset>
<SummaryStats>
COMPLETE: stresstext_1 - complete in 186 msecs memory=0 Mb agentsreply=7615529 duplicatePackets=0 resentPackets=0 resultsize=158 continue=0 TimeLocalExecute=181.912ms NumRowsProcessed=180001 NumIndexSeeks=119900 NumIndexScans=60001 NumIndexWildSeeks=60000 NumLeafCacheHits=60160 NumNodeCacheHits=60000 NumIndexAccepted=60000 NumIndexRowsRead=60000 NumAllocations=360001 SizeAgentReply=7.262MB TimeAgentWait=98.307ms TimeAgentQueue=35.190ms NumSocketWrites=2 SizeSocketWrite=158B TimeSocketWriteIO=28.473us NumSocketReads=2 SizeSocketRead=36B TimeSocketReadIO=6.361us TimeAgentProcess=384.002ms
</SummaryStats>
There is also easy access to this functionality from ECLWatch. If you go to the test pages for a query in the new release you can enable the “Get summary stats” option:
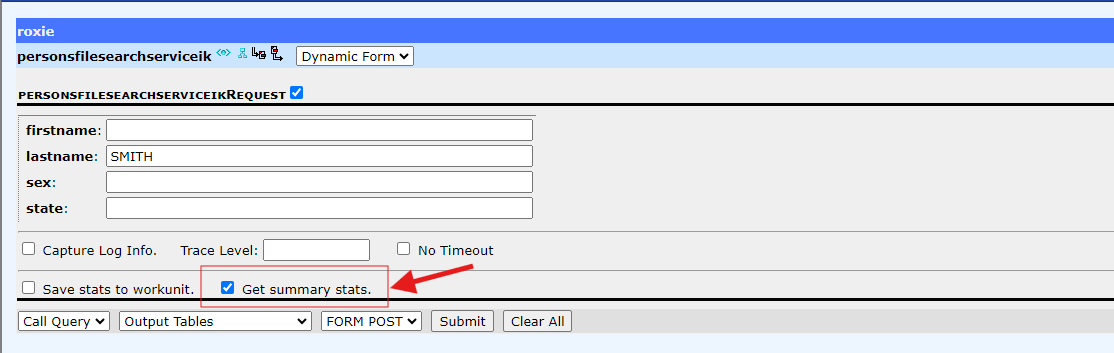
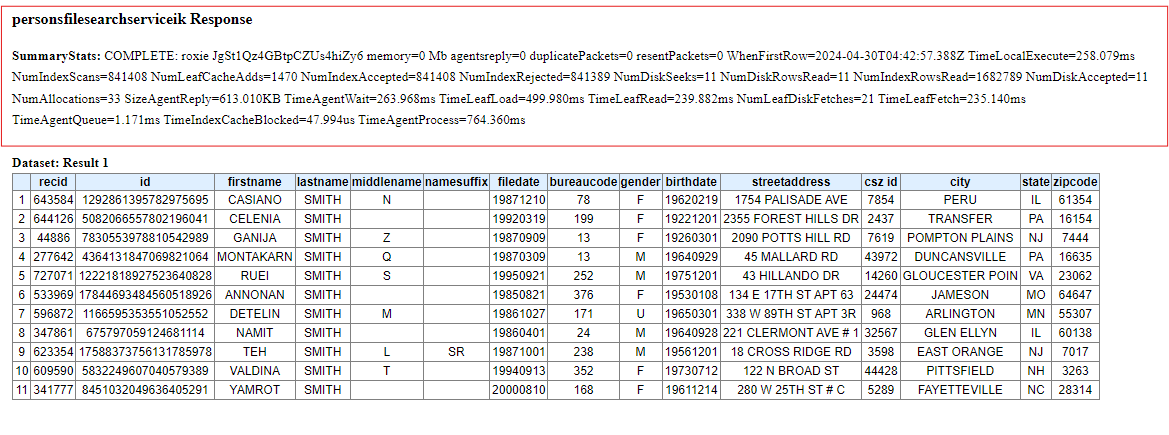
As you can see, the summary information has also been extended and now includes:
- Index performance: TimeLeafLoad, TimeLeafRead, TimeLeafFetch
- Time spent in the agents: TimeAgentWait, TimeAgentQueue, TimeAgentProcess
- Time spent communicating with the client: SocketRead, SocketWrite
These statistics have been added to help the users identify bottlenecks in Roxie’s query performance. The following provides some examples of how that information can be interpreted.
In Example 1 below, the blue highlighted sections show that more than two-thirds of the query time in this search was spent SOAP calls (219.9 ms of a 318 ms query).
Example 1:
COMPLETE: XYZService from 127.0.0.1 complete in 318 msecs memory=10 Mb priority=-2 agentsreply=348 duplicatePackets=0 resentPackets=0 resultsize=2639 continue=0 NumRowsProcessed=4050 NumIndexSeeks=3 NumNodeCacheHits=2 TimeSoapcall=219.900ms TimeSortElapsed=70.282us NumGroups=23 TimeLocalExecute=228.908ms NumAllocations=13239 SizeAgentReply=348b TimeAgentWait=290.170us
 fREGEXREPLACE={ NumStarts=12 NumStops=12 TimeLocalExecute=29.774us }
 fCleanLNBO={ NumStarts=2 NumStops=2 TimeLocalExecute=5.488ms }
Example 2 below reveals a couple of function calls taking a notable amount of time. While the function calls only account for 30% of the query time (just over six seconds of the total 21.6 second query time), they are worth investigating further.
Example 2:
COMPLETE: XYZService from 127.0.0.1 complete in 21581 msecs memory=229 Mb priority=-2 agentsreply=1391745 duplicatePackets=0 resentPackets=0 resultsize=4921 continue=0 NumRowsProcessed=366264 NumIndexSeeks=2156 NumIndexScans=3564 NumIndexWildSeeks=693 NumIndexMerges=17 NumLeafCacheHits=371 NumNodeCacheHits=1533 NumLeafCacheAdds=531 NumNodeCacheAdds=809 NumIndexAccepted=3129 NumIndexRejected=842 NumAtmostTriggered=1 NumIndexRowsRead=3562 TimeSortElapsed=1.695ms NumGroups=13125 TimeLocalExecute=1m58.651s NumAllocations=105032652 SizeAgentReply=1.327Mb TimeAgentWait=1.194s TimeNodeLoad=20.840ms TimeNodeLoad=1.781s TimeLeafLoad=212.174ms TimeNodeRead=13.356ms TimeLeafRead=56.810ms NumNodeDiskFetches=55 NumLeafDiskFetches=208 TimeNodeFetch=3.692ms TimeNodeFetch=2.759ms TimeLeafFetch=55.071ms TimeLeafFetch=193.175us NumSocketWrites=2 SizeSocketWrite=4.805Kb TimeSocketWriteIO=39.891us NumSocketReads=2 SizeSocketRead=5.307Kb TimeSocketReadIO=27.626us TimeIndexCacheBlocked=24.048us TimeIndexCacheBlocked=4.645us
 fgetLinksets={ NumStarts=1 NumStops=1 TimeLocalExecute=4.414s }
 fget_javamodel={ NumStarts=1 NumStops=1 TimeLocalExecute=1.607s }
Slightly surprisingly, the blue highlight in Example 3 shows that the total time to load the required index node (82.8 ms and 149.2 ms) is longer than the query itself (170 ms). This is because Roxie is executing multiple index operations in parallel, possibly for different index parts.
Example 3:
COMPLETE: XYZService from 127.0.0.1 complete in 170 msecs memory=9 Mb priority=-2 agentsreply=98383 duplicatePackets=24 resentPackets=24 resultsize=2672 continue=0 NumRowsProcessed=4213 NumIndexSeeks=234 NumIndexScans=670 NumIndexWildSeeks=64 NumIndexMerges=10 NumLeafCacheHits=20 NumNodeCacheHits=196 NumLeafCacheAdds=60 NumNodeCacheAdds=27 NumIndexAccepted=686 NumIndexRejected=517 NumIndexRowsRead=1187 TimeSortElapsed=923ns NumGroups=122 TimeLocalExecute=306.564ms NumAllocations=23946 SizeAgentReply=96.077Kb TimeAgentWait=163.534ms Example 3 also shows the ratio of cache hits versus adds, which provides an idea of how well the index cache is working. The sections highlighted in green show ten percent of branch requests and 75 percent of leaf requests are going out to the disk.
If a large number of branch requests are needing to read from disk then it may be worth increasing the size of the branch cache. If a large number of leaf nodes are being read from disk, then it may be worth increasing the memory available to the process or experimenting with the size of the leaf cache – reducing it may actually improve performance when the system is heavily contended.
The statistics provided in the log or returned when you run a query can provide some clues to the bottlenecks in Roxie queries, but often optimizing individual queries will require more information. Thankfully, Roxie can also generate detailed timing information when running a query, which we can view in a special statistics workunit in ECLWatch.
When you provide the option highlighted below to testsocket, Roxie creates a workunit that contains all the activity stats and returns the id of that workunit along with the results.
$ testsocket . "<stresstext_1 statsToWorkunit='1'/>"

<Dataset name='Result 1'>
<Row><Result_1>true</Result_1></Row>
</Dataset>
<Dataset name='Result 2'>
<Row><Result_2>Done</Result_2></Row>
</Dataset>
<Statistics>
<wuid>W20230816-144622</wuid>
</Statistics>
Similarly, you can have access to this feature in ECLWatch by enabling the “Save stats to workunit” option in the test pages for a query:
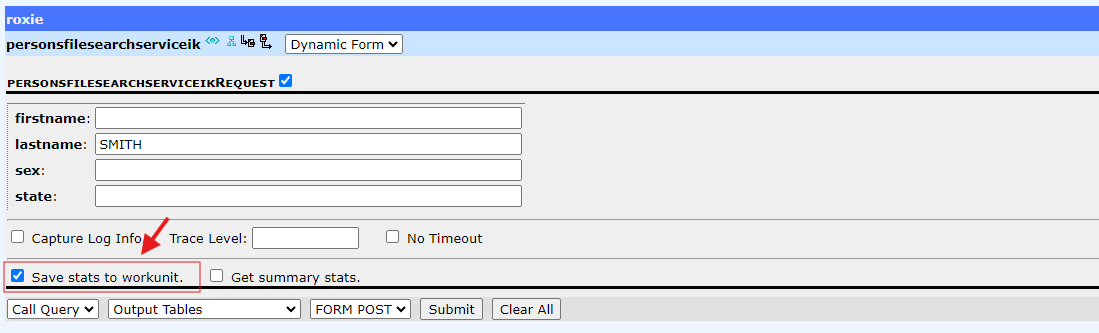
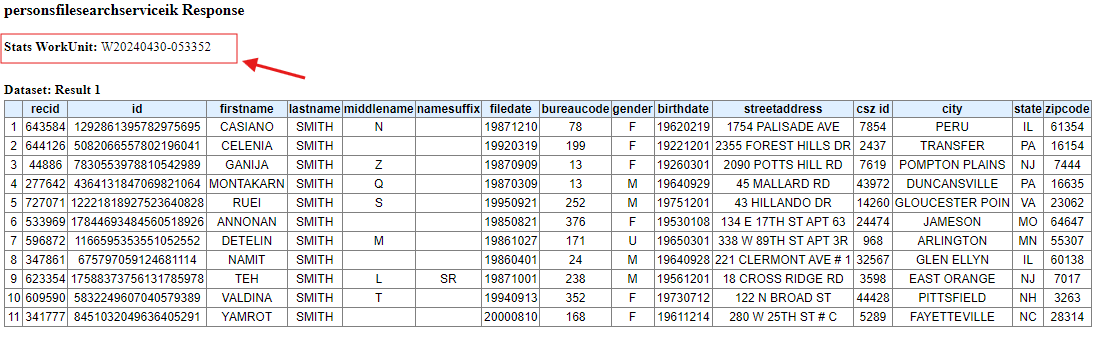
You can then view this special stats workunit in the normal way in ECLWatch, assess detailed activity timings, and graph to spot any potential bottlenecks.
Part 2 coming soon
Part two of this blog series will highlight some recent updates made to Roxie that are helping reduce query times by increasing the amount of data in memory.
About the Author

Gavin Halliday
SVP and Head of Platform Engineering, LexisNexis Risk Solutions
As the SVP and Head of Platform Engineering, Gavin is the lead for open-source platform development. He has been with LexisNexis Risk Solutions for more than 30 years and is one of the original architects of the HPCC System platform. He has worked on many parts of the system over the years and is the lead developer of the HPCC Systems ECL code generator.