HPCC Systems log visualizations using ELK
Log visualization integration with ECL Watch using ELK (ElasticSearch, Logstash and Kibana) was introduced in HPCC Systems 7.0.0. Log visualizations help identify, track and predict important events and trends on HPCC Systems clusters, by spotting interesting patterns and giving you visual clues which are easier to interpret than reading through the log file itself.
While we could have engineered a solution ourselves, we decided to use ELK because it provides what we need, is widely available and is yet another way of connecting HPCC Systems with a third party solution, that provides you with flexibility in your use of our system.
ELK is a third party technology for creating visualizations from raw data which allows you to:
- Search and filter through large quantities of data fast via an API
- Organise and search log files
- Present the results in a visual interface via a browser
We wanted to create visualizations based on transactions handled by the ESP and Roxie components in HPCC Systems. The purpose of this blog is to share our experience of using ELK, to demonstrate how useful is it in providing important information to users who are managing HPCC Systems in a variety of roles.
Below is an example showing how we integrated the Elastic stack (formerly known as ELK), into our own ECL Watch browser based user interface. Within the Operations area, you can see the new Log Visualization tab which, in this case, is monitoring traffic on the ESP showing the number of requests made to the server over a specified time period, request count by user, time stats by request type and Roxie query elapsed time stats.
HPCC log visualizations – Kibana dashboard integrated in ECLWatch 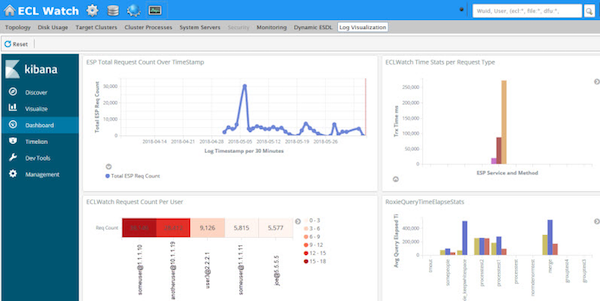
So how did we go about integrating ELK into ECL Watch? There are 4 main tasks involved in the creation of the visualizations:
- Create an appropriately resourced ELK system. We briefly describe the ELK system created for this task, but it’s a good idea to make sure you have a good understanding the Elastic (ELK) stack and the process to create a working ELK system
- Identify the appropriate HPCC Systems log data and create ELK rules to process this log data.
- Create the log visualizations in Kibana.
- Configure HPCC Systems to integrate the visualizations.
To reduce any potential performance impact on the host HPCC Systems components, we chose to run all ELK components remotely. However, we did choose to use ELK’s “Filebeat” component locally to harvest the log entries we targeted and forward those log entries to a remote LogStash for filtering/parsing. Our LogStash instance forwards parsed log entries to a remote ElasticSearch instance, which in turn is targeted by our Kibana instance.
All major HPCC Systems components provide informative logs, but for this exercise we focused on the ROXIE and ESP components, although you can target any HPCC Systems component log.
It is important to note that all HPCC Systems component logs follow a format defined in the environment.conf file (and can be reconfigured), but in our implementation we are working with the system default log format configuration. Just for reference, the logs are configured by default to contain the following columns (delimited by spaces):
SequenceNumber Date-TimeStamp ProcessId ThreadId QuotedMessage
Here’s a sample ESP log entry which reflects the default log format:
000717B7 2018-06-05 16:15:59.017 614468 771767 "TxSummary[activeReqs=1;contLen=37;rcv=0ms;handleHttp=134ms;user=someuser@1.176.1.1;req=POST wsworkunits.WUQUERY v1.73;total=134ms;]"
We created Filebeat prospectors to target ESP log entries of type “TxSummary” because those log entries contain abbreviated transaction information for all completed transactions (successful and otherwise). It is wise to limit the number of log entries processed due to the added strain on the local and remote resources. We were interested in visualizing statistics about all ESP transactions, so these entries contained most of the information we needed. There might be other log entry types of interest you might want to use based on the needs of your users. For example, we also chose the ROXIE “COMPLETE” log entries for the same reasons.
We created two filebeat prospector types in the filebeat.yml (configuration file used by filebeat). Our prospectors target the current esp.log file for an esp component called myesp, installed in the standard location on linux systems (/var/log/HPCCSystems/myesp/esp.log). The prospector adds a field called “component” and this is populated with the component type (in this sample esp/roxie). This same field is used later by Logstash in order to properly process the message. The prospector is only interested in messages that contain the “TxSummary” prefix in the message column (our include_lines rule describes the standard log format as discussed above).
Take a look at this snippet from our filebeat.yml:
filebeat.prospectors:
- type: log
                enabled: true
                 paths:
     - /var/log/HPCCSystems/myesp/esp.log
fields:
     component: esp
fields_under_root: true
   encoding: plain
   include_lines: ['([A-Z-0-9]{8})\s+(\d{4}-\d{2}-\d{2}\s\d{2}:\d{2}:\d{2}.\d{3})\s+(\d+)\s+(\d+)\s+(\"TxSummary)']
   multiline.pattern: ([A-Z-0-9]{8})\s+(\d{4}-\d{2}-\d{2}\s\d{2}:\d{2}:\d{2}.\d{3})\s+(\d+)\s+(\d+)\s+(\")
   multiline.negate: true
   multiline.match: after
- type: log
   enabled: true
   paths:
     - /var/log/HPCCSystems/myroxie/roxie.log
   fields:
     component: roxie
   fields_under_root: true
   encoding: plain
   include_lines: ['([A-Z-0-9]{8})\s+(\d{4}-\d{2}-\d{2}\s\d{2}:\d{2}:\d{2}.\d{3})\s+(\d+)\s+(\d+)\s+(\"\[\d{1,3}\.\d{1,3}\.\d{1,3}\.\d{1,3}:\d{1,5}\{\d+\}\]\s+COMPLETE:)']
   multiline.pattern: ([A-Z-0-9]{8})\s+(\d{4}-\d{2}-\d{2}\s\d{2}:\d{2}:\d{2}.\d{3})\s+(\d+)\s+(\d+)\s+(\")
   multiline.negate: true
   multiline.match: after
The filebeat prospector is configured to forward the log entries to our remote Logstash instance which is configured to listen for these messages on a particular address and port, (X.Y.Z.W:5044 for this example):
#----------------------------- Logstash output ---------------------
    output.logstash:
       # The Logstash hosts
       hosts: ["X.Y.Z.W:5044"]
We configured our logstash instance to listen for our Filebeats ESP/ROXIE log messages on a particular port via a simple input statement in the Logstash.conf file:
input
{
   beats
   {
     port => 5044
   }
}
We also created a set of Logstash filters which process the HPCC Systems component specific log messages forwarded by the filebeats, as discussed above. The filters parse the ESP(TxSummary)/ROXIE(COMPLETE) log entries into individual key/value pairs, reformat the field names and provide field type as needed in order to facilitate indexing of the data.
filter
{
   if [component] == "roxie"
   {
     grok
     {
       match => { "message" => "%{BASE16NUM:sequence} %{TIMESTAMP_ISO8601:logtimestamp} +%{INT:processID} +%{INT:threadID} +\"\[%{IPV4:InstanceIP}:%{INT:InstancePort}\{%{INT:TransactionID}\}] +COMPLETE: +%{WORD:queryname} - from +%{IPV4:QueryIP} complete in +%{NONNEGINT:ElapsedTime} msecs %{GREEDYDATA:keyvalues}"}
     }
     kv
     {
       source => "keyvalues"
       field_split => " "
       value_split => "="
     }
     mutate
     {
       remove_field => [ "message", "@version" , "keyvalues", "prospector" ]
       convert =>
       {
         "NumRowsProcessed" => "integer"         "TimeElapsed" => "integer"
         "TimeFirstExecute" => "integer"         "TimeLocalExecute" => "integer"
         "TimeTotalExecute" => "integer"         "continue" => "integer"
         "ElapsedTime" => "integer"         "resultsize" => "integer"
         "querynumber" => "integer"         "InstancePort" => "integer"
         "slavesreply" => "integer"         "memory" => "integer"
         "priority" => "integer"         "InstanceId" => "integer"
       }
     }
     date
     {
       match => [ "logtimestamp", "YYYY-MM-dd HH:mm:ss.SSS" ]
     }
   }
  else if [component] == "esp"
   {
     grok
     {
       match => { "message" => "%{BASE16NUM:sequence} %{TIMESTAMP_ISO8601:logtimestamp} +%{INT:processID} +%{INT:threadID} %{QUOTEDSTRING:logmessage}" }
     }
     kv
     {
       source => "logmessage"
       field_split => "\[;"
       value_split => "="
     }
     mutate
     {
       remove_field => [ "message", "@version" ]
       rename =>
       {
          "total" => "TotalTrxmS"          "rcv" => "TimeReceived"
          "handleHttp" => "TimeHttpHandled"          "user" => "UserAtIP"
          "req" => "RequestSrvcMeth"
       }
       convert =>
       {
         "TotalTrxmS" => "integer"         "contLen" => "integer"
         "activeReqs" => "integer"         "TimeHttpHandled" => "integer"
         "TimeReceived" => "integer"         "threadID" => "integer"
         "processID" => "integer"
       }
     }
   }
}
Lastly we devised a couple of rules to forward parsed log entries to ElasticSearch and create daily (timestamped) component specific indexes:
output
{
   if [component] == "roxie"
   {
     elasticsearch
     {
       hosts => ["yourelasticsearchaddress:9200"]
       index => "roxie-log-%{+YYYY.MM.dd}"
     }
   }
   else if [component] == "esp"
   {
     elasticsearch
     {
       hosts => ["yourelasticsearchaddress:9200"]
       index => "esp-log-%{+YYYY.MM.dd}"
     }
   }
At this point, the desired messages should be indexed on ElasticSearch and should be searchable. Kibana provides mechanisms to create visualizations based on queries into the indexes created from the Logstash-forwarded messages.
Visualize the log data that helps you and your users
The collection of stats we chose to visualize for our tests is a very small subset of what is available to you, but they give you a feel for the possibilities. We hope the following examples will get you thinking about the kinds of stats you might find useful to visualize, which may help you monitor events and trends important to your use of HPCC Systems.
This visualization shows how many requests have been received by ESP over time, which helps evaluate work load trends:
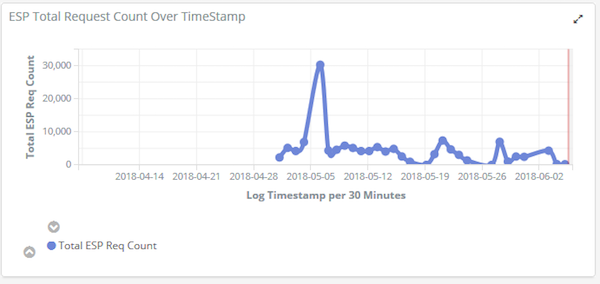 Log Visualization of ESP requests count over time
If your responsibilities include managing a set of Roxie queries, our next visualisation helps you to identify anomalies in the time Roxie queries have taken to complete. Spikes in this graph show when a query is taking longer than usual, which may need investigating. While your investigations may eventually show that this was an expected change, it may also be a sign of trouble, such as a problem with the data or inefficiency with how the query is coded.
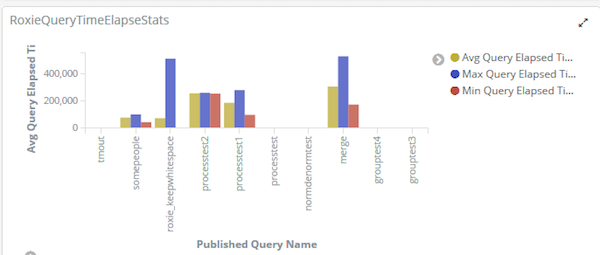 Log Visualization of Roxie query runtime stats
The following graph shows all the Roxie nodes in a cluster and the number of Roxie queries processed by each node. Ideally, you would want to see an even balance across all nodes. In the graph below, you can see where one node handled significantly more queries than the rest. If you are an operations user, you may be prompted to check that your VIP is routing correctly, or look for some other system related cause. If you are an ECL developer or query manager, you may be wondering whether the data has been evenly distributed across all nodes or perhaps the data has been skewed by some other issue such as a disproportionate numbers of queries for a specific search where one node has processed all those queries.
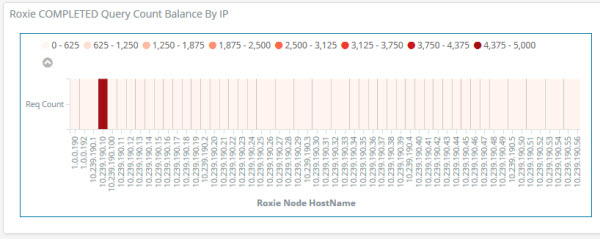 Total Roxie query count per node (100-Node Roxie job balance)
This visualization shows who is using the system and the number of requests each user has submitted to the ESP, indicating the level of work load they have been producing.
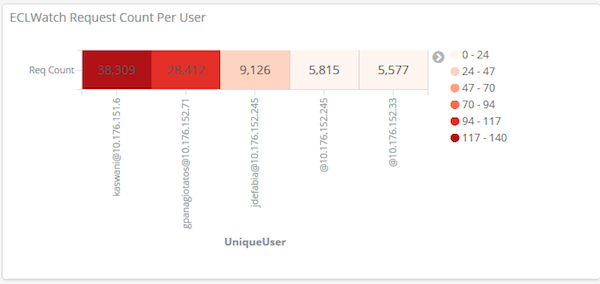
ECL Watch request count per user
The HPCC Systems log files themselves are a great source of information, but it’s not always easy to predict events that may put your system on the threshold of a potential problem, by simply looking through them. Plus, recognising the signals from the log file alone may require a level of knowledge and experience that some users may not have.
Using the information in our logs to create visualizations using ELK, can give all users, regardless of their knowledge and experience, very clear signs of the need to act. Even if it is not always possible for a user to know what the root cause is, prompting them to ask the question may make the difference between preventing issues from escalating, rather than being reactive when they have already happened. So the possibilities and potential benefits speak for themselves.
Configuring ELK Log Visualization integration with ECL Watch
Integrating your ELK based visualizations into ECL Watch can be configured and enabled using the HPCC Systems Configuration Manager using the following settings:
- Click and expand the ESP Service link (on the left), selecting the EclWatch link.
- Select the Elk Log Visualization tab from the right side and provide the following information:kibanaAddress – The IP address for your Kibana component
kibanaPort – The Kibana port number
kibanaEntryPointURI – The Kibana URL pointing to your shared Kibana dashboard. For example, /app/kibana#/dashboard/etc
We’d like to know what sorts of HPCC Systems log stats you may find useful to visualize using this method. Use our forum to share your ideas with us and our open source community, adding an image to show the visualisation(s) from the data you used.