Nifty Features in ECL Watch (Version 9.0)
With the HPCC Systems® platform version 9.0, an updated and improved ECL Watch interface is in place. You may have seen the Technical Preview of this interface as it was available in previous versions of the platform. The new version has more than just cosmetic changes, it is intended to improve the user experience with new ease-of-use and productivity-enhancing features.
There is a convenient Transition Guide available on the HPCC Systems Wiki. That guide will help you learn how to use the new interface for features you’ve already grown accustomed to using. This blog is intended to highlight and explain some of the new features of ECL Watch.
Note: If you ever want to switch back to the previous interface, there is an option in the Advanced Menu to use the previous interface.
Navigation Paradigm Shift
The interface now has standardized URLs and friendlier navigation.
One non-obvious but important feature is the use of standardized URLs and more intuitive address in the address bar. You can now copy the text from the address bar and share that via email or private message and the recipient can follow the link to see exactly what you see. This includes any filters you used. You can also use the right-click -> Open in new tab feature of your browser. If you multiselect items in a list and press the Open button, it opens each item in a new tab. Some browsers may block this behavior initially to prevent pop-ups, so make sure to allow them, if needed.
You can also navigate using the browser’s Forward and Back buttons. In addition, you can use the browser’s refresh feature at any time. The refresh buttons inside a page are still there and they still serve the same purpose. Those buttons perform a lighter operation than a full page refresh.
You can also use the browser’s Bookmark feature to save a place inside ECL Watch.
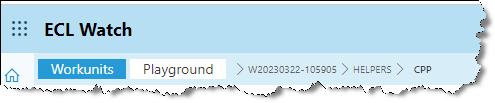
Some areas of ECL Watch also show “breadcrumbs” to allow you to see how deep you have drilled down. For example, in the image below, we opened a workunit details page, then selected the Helpers tab, and opened the CPP file. Clicking on any of those breadcrumbs, takes you to that section.
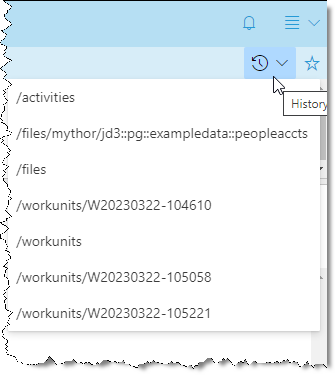
History / Favorites
In addition to your browser’s Bookmarks and History, you can see your history within ECL Watch. The droplist shows the last ten places you have been.
You can also save any page as a Favorite and return there quickly.
Night and Day
ECL Watch now supports Dark Mode. Some people swear that it is easier on their eyes. Others don’t care for it. The point is you get to choose . If this is the tool you have in front of you often, you should enjoy looking at it.
Press the ![]() button to switch from light mode to dark.
button to switch from light mode to dark.
Press the ![]() button to switch from dark mode to light.
button to switch from dark mode to light.
Made for Cloud, but still knows Bare-Metal
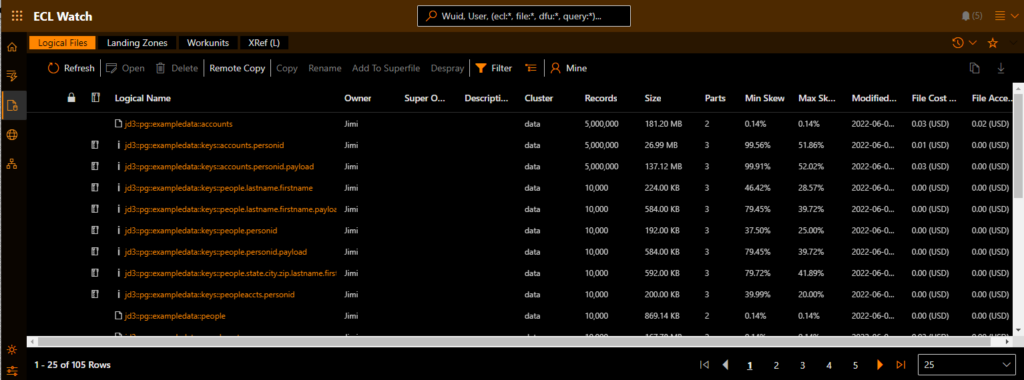
Cloud may be the future, but bare-metal is still valid. All the support for bare-metal deployments remains in place. For example, when accessing a bare-metal deployment, the Home page still shows Disk Usage. Also, the topology sections still function as they did before.
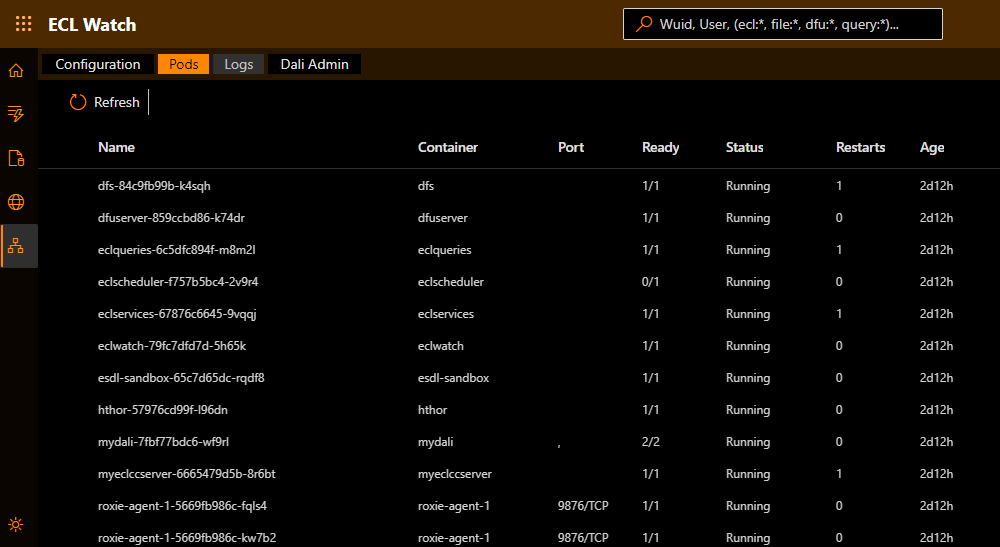
However, with a containerized deployment, the Operations tab becomes the Topology tab and has tabs for Pods and Services. These display similar information as you would find using kubectl get pods or kubectl get svc on the command line. This allows you to get pod and service information without requiring command line access.
Graphs and Metrics
The Graphs tab on the Workunit details page has been renamed to Metrics. It provides access to metrics that may be of interest to ECL Developers. It is now easier to navigate through your graphs and activities, as well as see other metrics for your workunit.
The Timeline is still there but you can now toggle it on or off using the ![]() button. Clicking on a section in the timeline filters the metrics list.
button. Clicking on a section in the timeline filters the metrics list.
Below it is the Graphs list. Entering text filters the items displayed in the list. Prefixing the filter with a metric will filter on that prefix, for example, “Label:Sort” (case sensitive). Both the metrics list and the graph support multi-selection. This is useful when using the crosstab view.
You can also adjust which columns display using the Options button. If you select an item, the graph displays. If you multiselect items, then graphs for all selected items display.
As you change your view, the Browser history and URL in the address bar reflect those changes. In other words, you can use the back button to see a previous metric selection or bookmark a current metric selection.
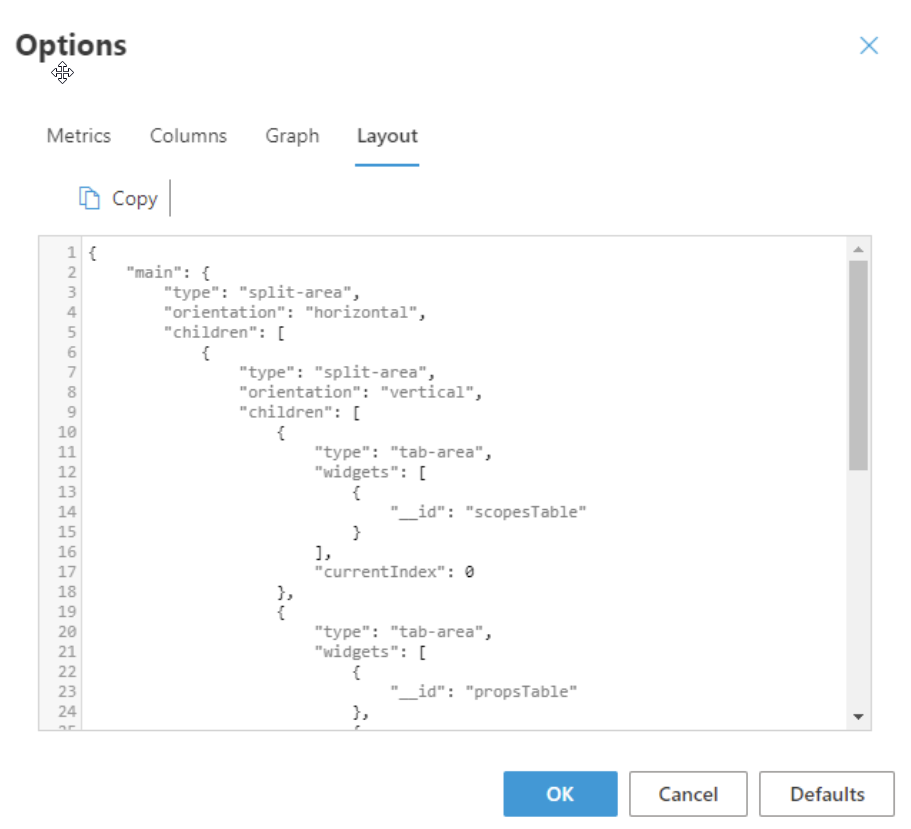
You can drag and drop panels on the Metrics page to your liking and you can reset using the Defaults button on the Options -> Layout tab.
Topology
For a bare-metal deployment, the topology sections still function as they did before. But for a containerized deployment, there are features useful for troubleshooting your system.
Pods and Services
The Pods tab displays similar information as you would find using kubectl get pods on the command line. The Services tab displays similar information as you would find using kubectl get svc on the command line. This allows you to get pod and service information without requiring command line access.
Logs
The Logs tab allows you to see logs for each pod. This is similar to what you would see using kubectl logs <podname> on the command line.
Dali Admin
The Dali Admin tab provides access to most Dali Admin tasks. This tool helps you troubleshoot and maintain your system data store.
We think this new interface will improve your productivity and provide a better user experience. If you have any suggestions for other improvements or find any issues, please submit a Jira issue here.
Additional Resources
Here are some other ways to check out the new features now running in ECL Watch 9.0:
Videos
See the full list of available How To Videos. The newest available videos are:
- ECL Watch 9.0 Highlights
- The Download HPCC Systems Tech Talks – New 9.0 Release & ECL Watch Features
Wiki
An ECL Watch transition guide is also available on the HPCC Systems Wiki page.


Jim DeFabia
Documentation Lead
HPCC Systems
About the Author
Jim DeFabia is the Documentation Lead for HPCC Systems®. He entered the field of technical documentation in 1993 at Clarion Software/TopSpeed, where he helped revolutionize the industry by creating manuals that people could read and actually understand. It was at TopSpeed that he first met and worked with many of the HPCC “Mavericks.” So it was like coming home when he reunited with these colleagues in 2001 as they were initially developing the HPCC Systems® platform, which was then released to the Open Source community in 2011.