HPCC Systems Thor Monitor – Using Workunit Services and Power BI to Monitor Thor Activity
 Enterprise Control Language (ECL) Workunit Services standard library functions can be used to capture details about workunits running on Thor including processing time, errors, current state, and more. Capturing these details allows for monitoring, trending, error analysis, degradation, and other data points that can help improve the efficiency of Thor environments. In this blog, we will look at how to use this information to monitor the system with visualizations in Power BI.
Power BI is a visualization tool that allows the user to connect, model, and explore data with live dashboards and reports. This tool enables the user to publish, collaborate, and share data.
Jessica Skaggs, a consulting Software Engineer at LexisNexis Risk Solutions, introduced her work, “HPCC Systems Thor Monitor – Using Workunit Services and Power BI to Monitor Thor Activity” at HPCC Systems Tech Talk 32. The full recording of Jessica’s Tech Talk is available on YouTube.
In this blog post we:
- Look at a demo of the HPCC Systems Thor Monitor in Power BI
- Discuss Workunit Services standard library functions
- Examine flow of data from Thor to Power BI
HPCC Systems Thor Monitor Demo
This Thor monitor demonstration illustrates the following:
- Potential Problem Workunits
- Time by Date
- Graph Timings
- Errors
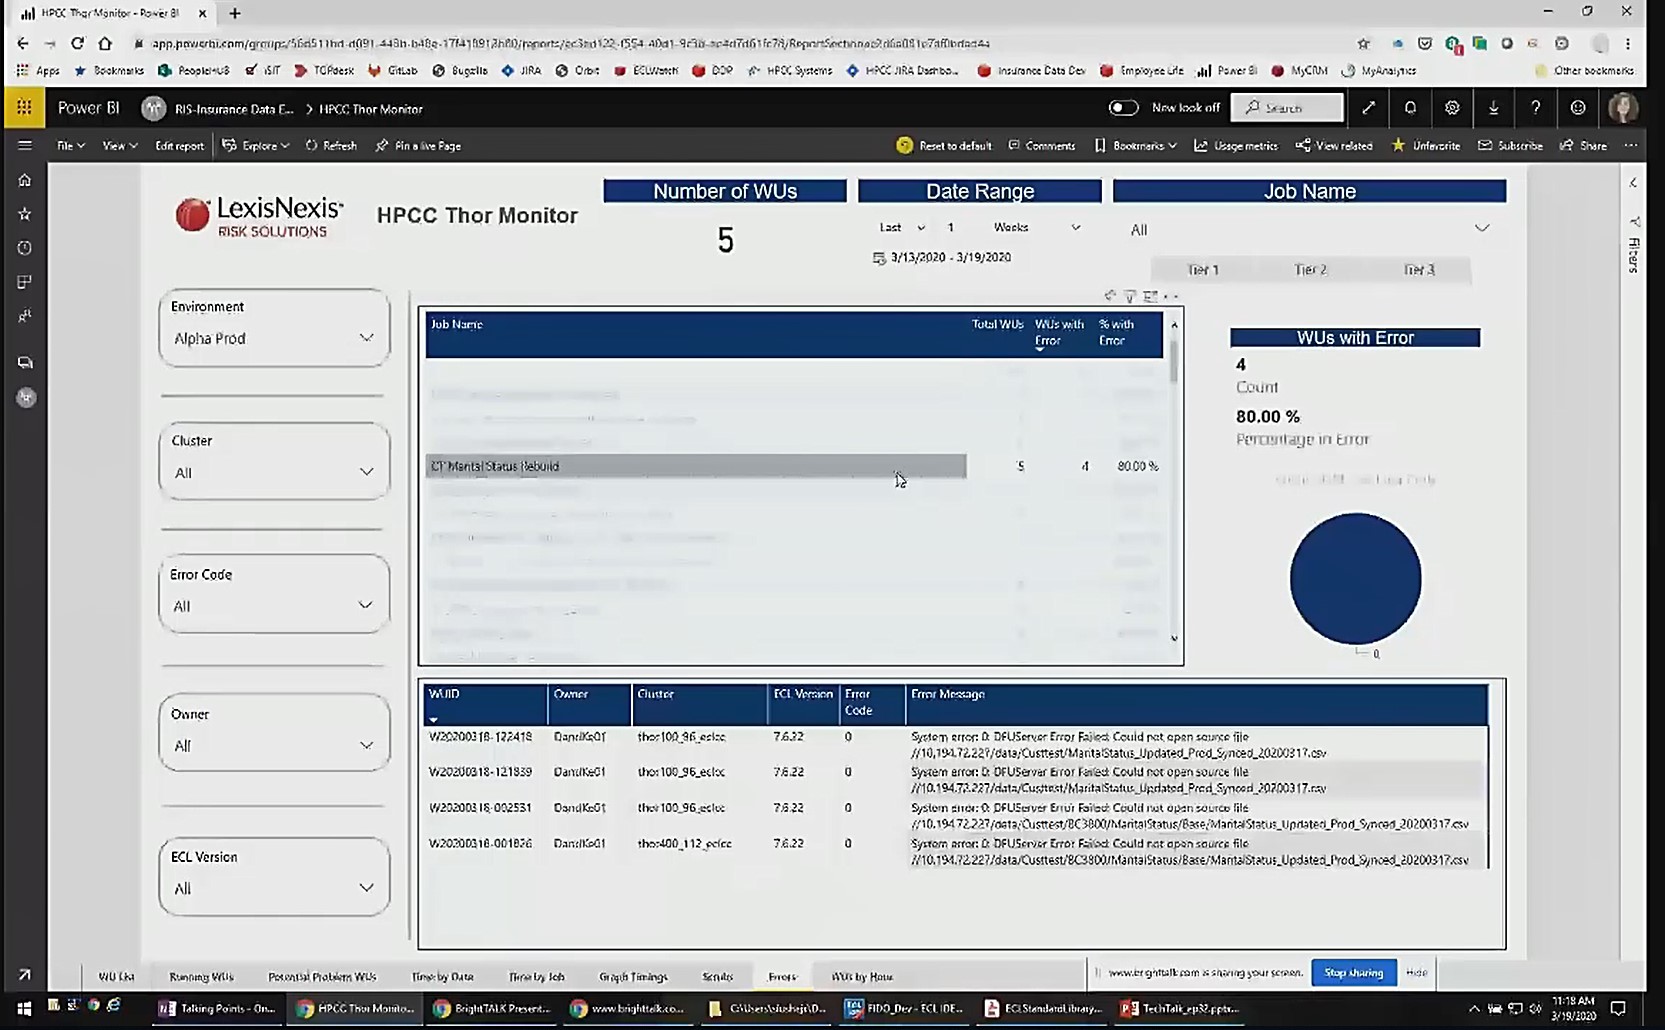
Image 1 is a view of the Thor monitor in Power BI. There are multiple pages to the report that can be seen along the bottom of the screen.
This view shows the collective workunits and the information collected about them.
The drop downs on the left allow for filtering of Environment, Cluster, State, Owner, and ECL Version. There are other details that can be filtered, such as Date Range and Job Name (shown at the top of the image).
Data is collected from multiple Thor environments. The Thor environment selected for this demonstration is “Alpha Prod.”
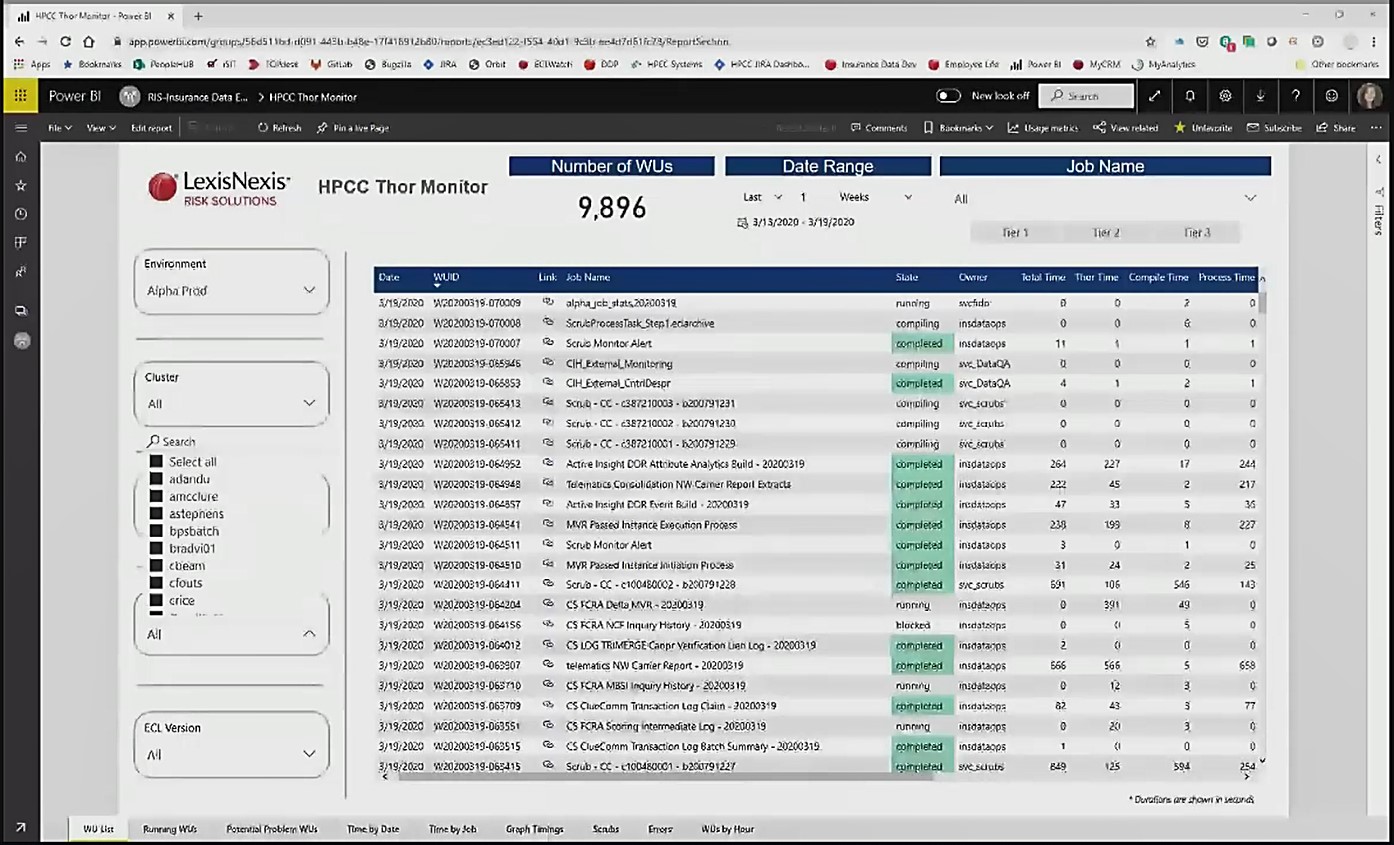
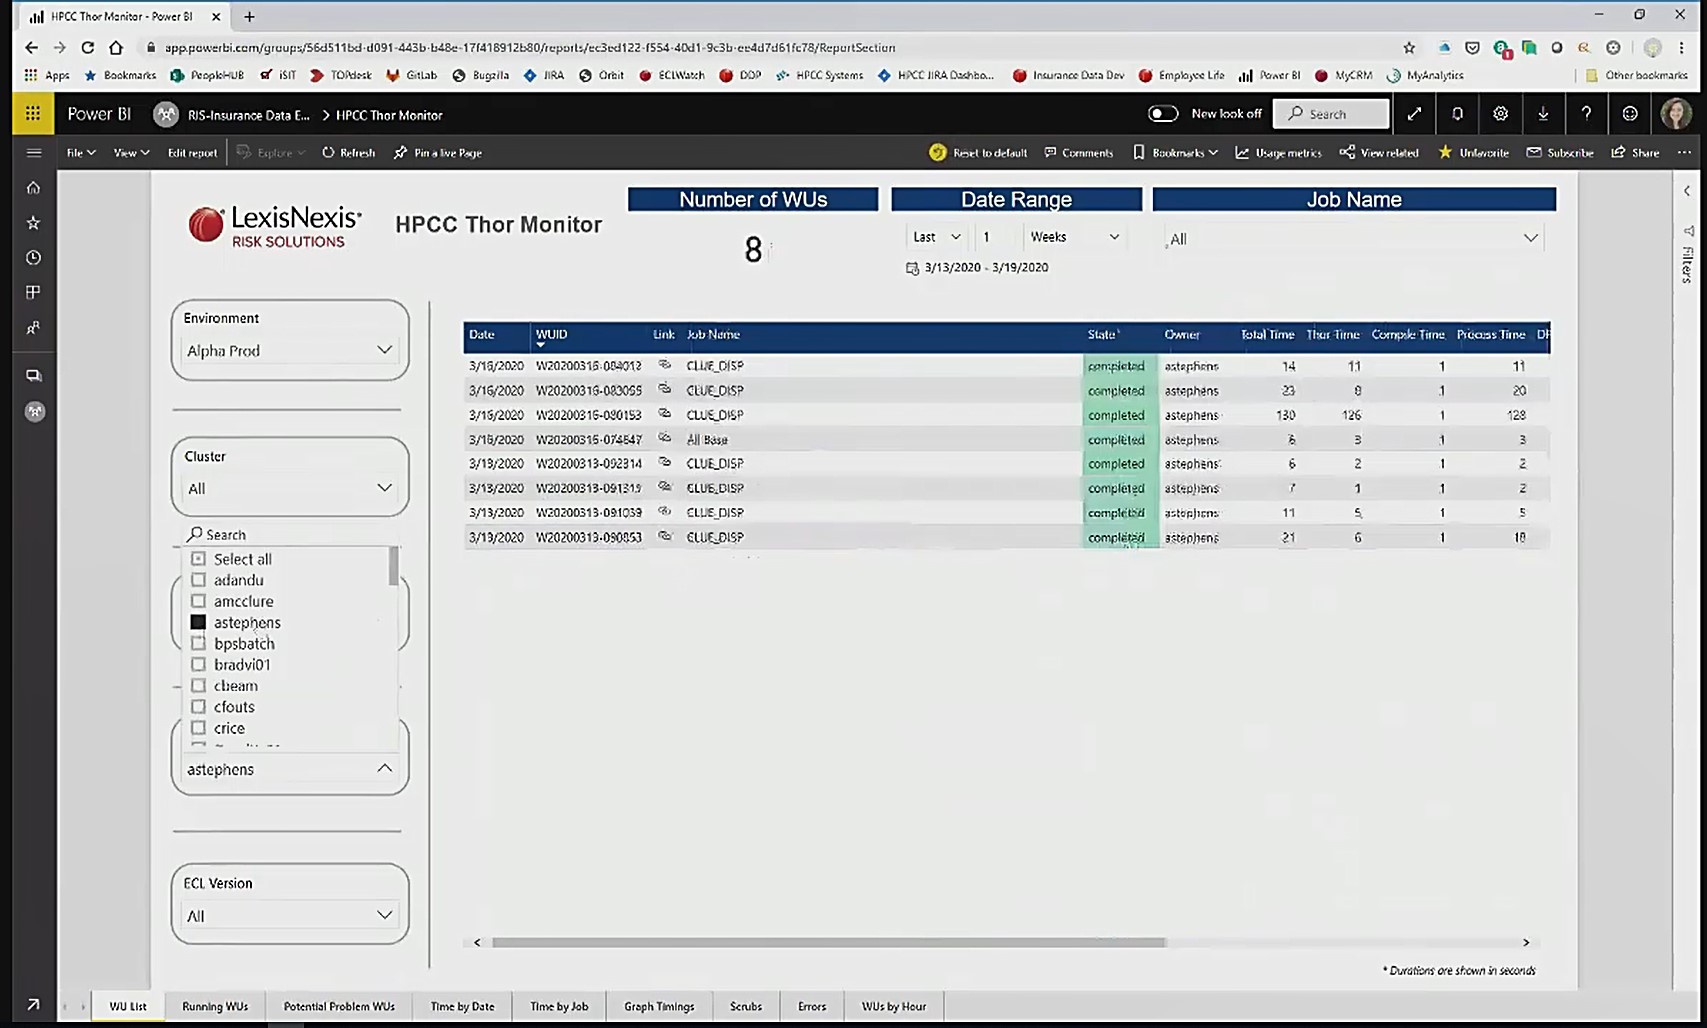
Image 2 shows how the “Owner” filter can be used to filter the workunits produced by a specific owner. In this image, the “Owner” filter was used to show workunits for “astephens.”
Potential Problem WUs
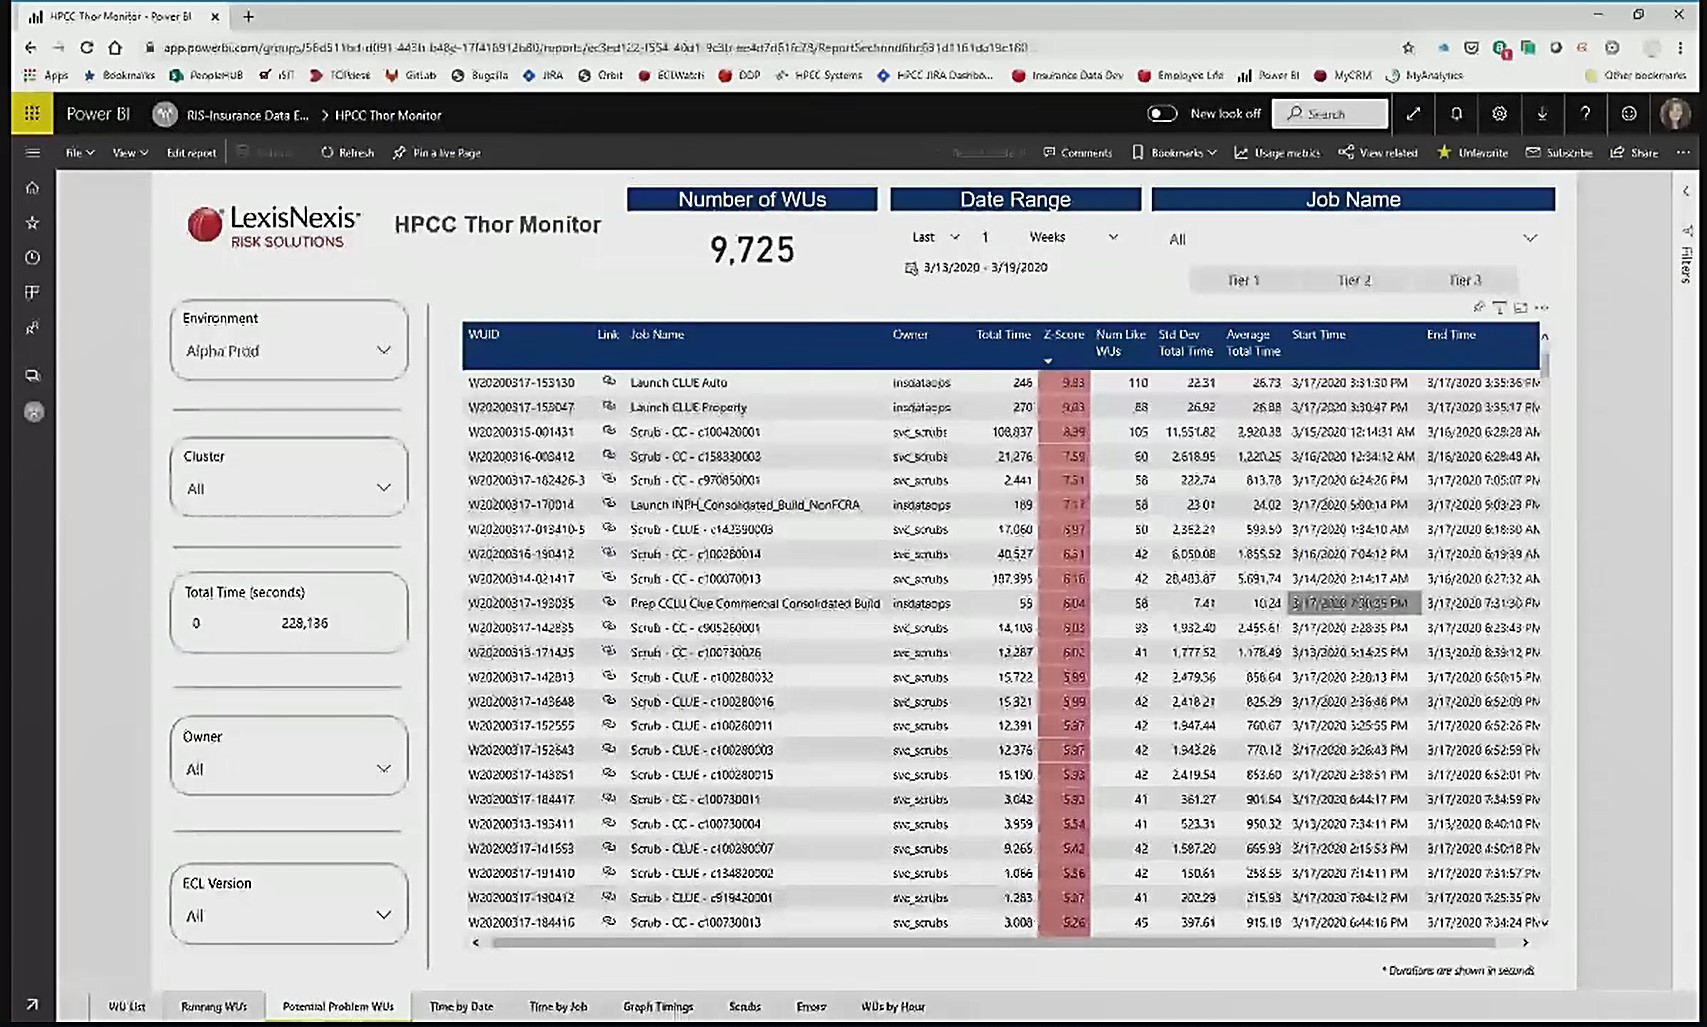
Image 3 shows the “Total Time” that the workunits took to run in seconds.
The “Std Dev Total Time” (standard deviation total time) and the “Average Total Time” are calculated for all workunits with the same “Job Name.”
The “Z Score” is the number of standard deviations away from the average for a workunit’s total runtime. The higher the number, the more time it took for the job to run, compared to average runtime.
For example, the first workunit took 246 seconds to run (“Total Time). The average time for the 110 workunits (“Num Like WUs”) with the same “Job Name” is 26.73 seconds. The “Total Time” for this workunit is 9.83 standard deviations (“Z Score”) away from the “Average Total Time,” so this workunit took longer than normal.
This gives the user the ability to identify potential issues. If there are numerous high Z Scores, it may point to an issue on the system as a whole. If a specific job has a number of high Z Scores, the issue may be with that particular job.
The workunits can be filtered for a job with a specific name to see how it has been performing over time.
The table can also be sorted by date, instead of Z-Score, to see if the runtime has been going up, or if the problem workunits are simply anomalies.
Time by Date
In image 4, the data has been filtered to show the total workunit runtimes by date, for date range 3/13/2020 to 3/19/2020.
The top visual shows the total runtimes in seconds for each day in the date range, with March 17th showing as the busiest. This is for all workunits in this environment.
The bottom visual breaks down the total time to show the “compile time,” “Thor time,” “process time,” and “dfu time.”
Each visual can be viewed at a year, month, day, or individual workunit level.
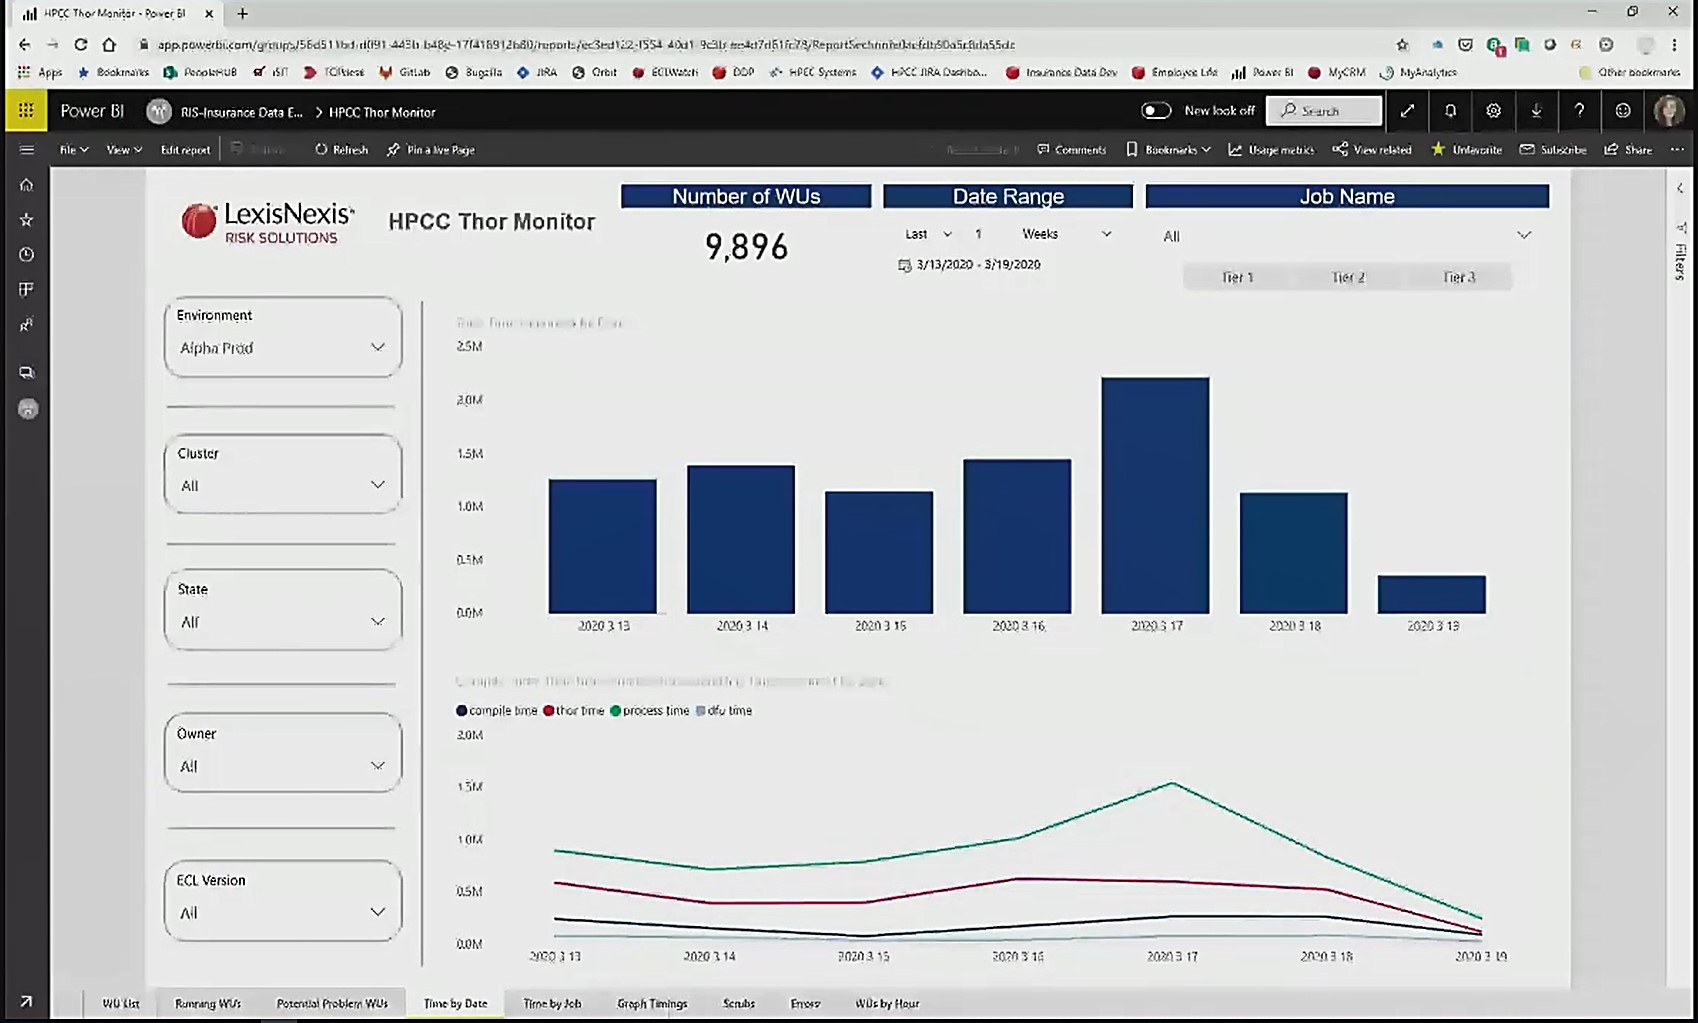
Image 5 shows workunit data over an 8 week period.
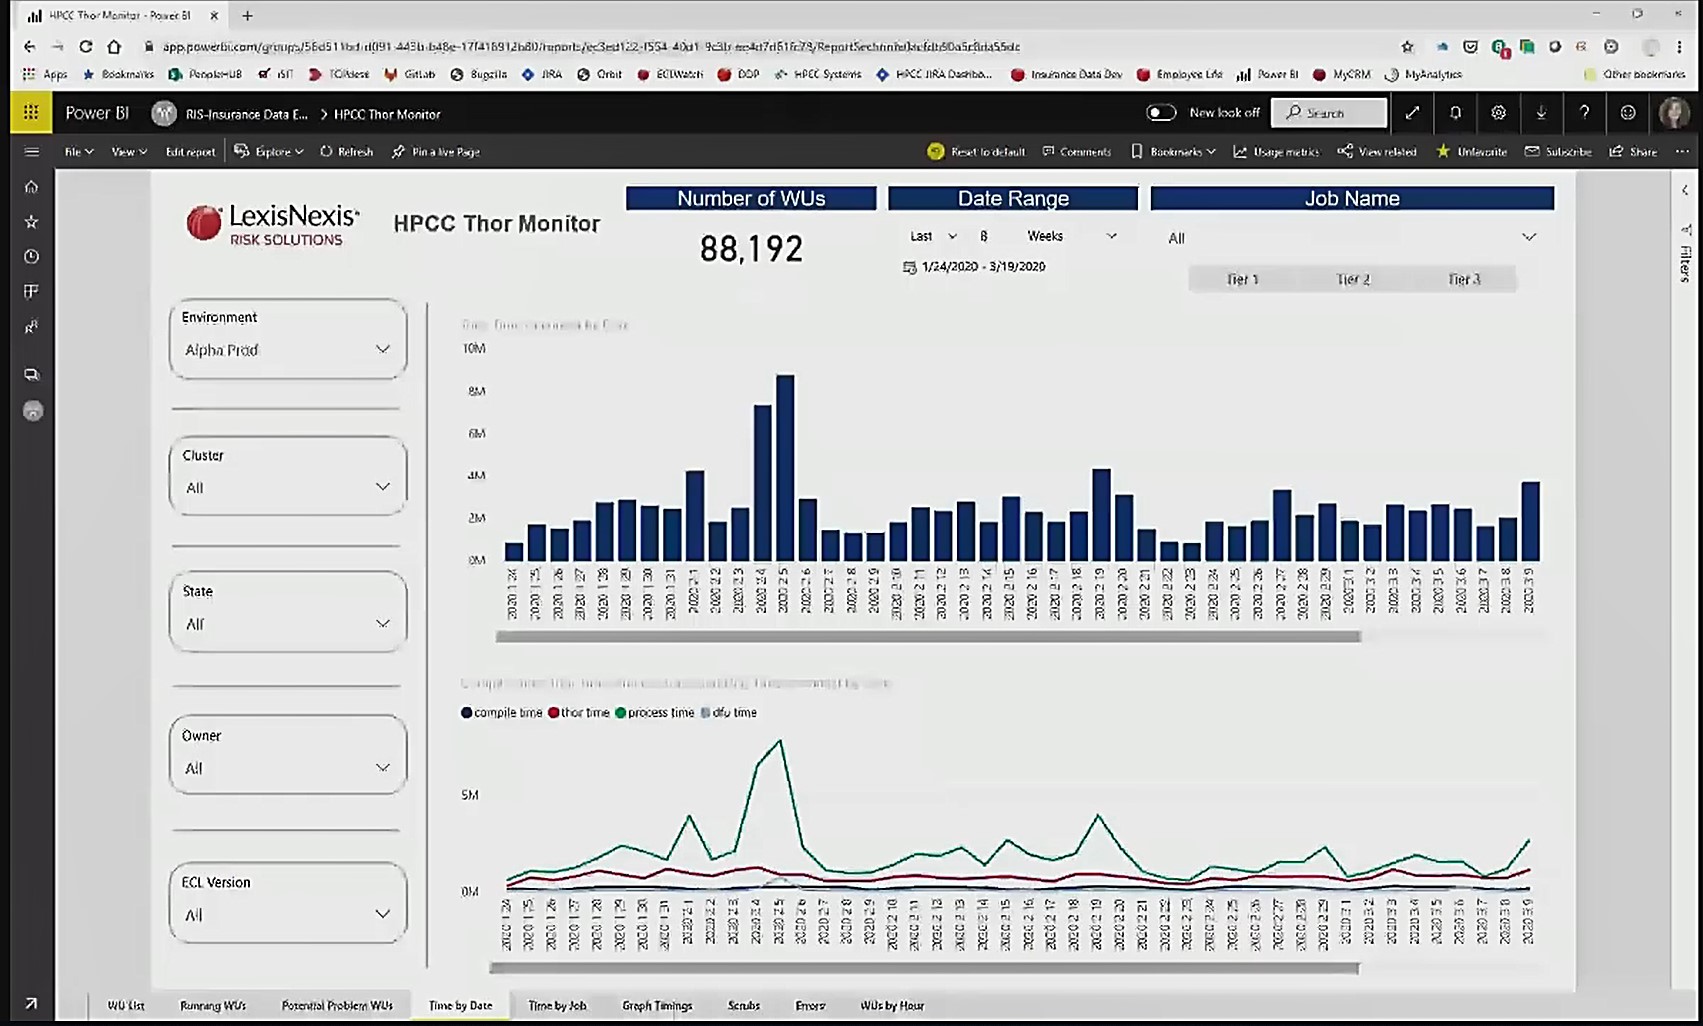
Image 6 shows month to month workunit runtimes.
In this view, if the user hovers over the words “Total Time (seconds) by date, a button will appear. This button is used to designate total runtime desired for a specific view.
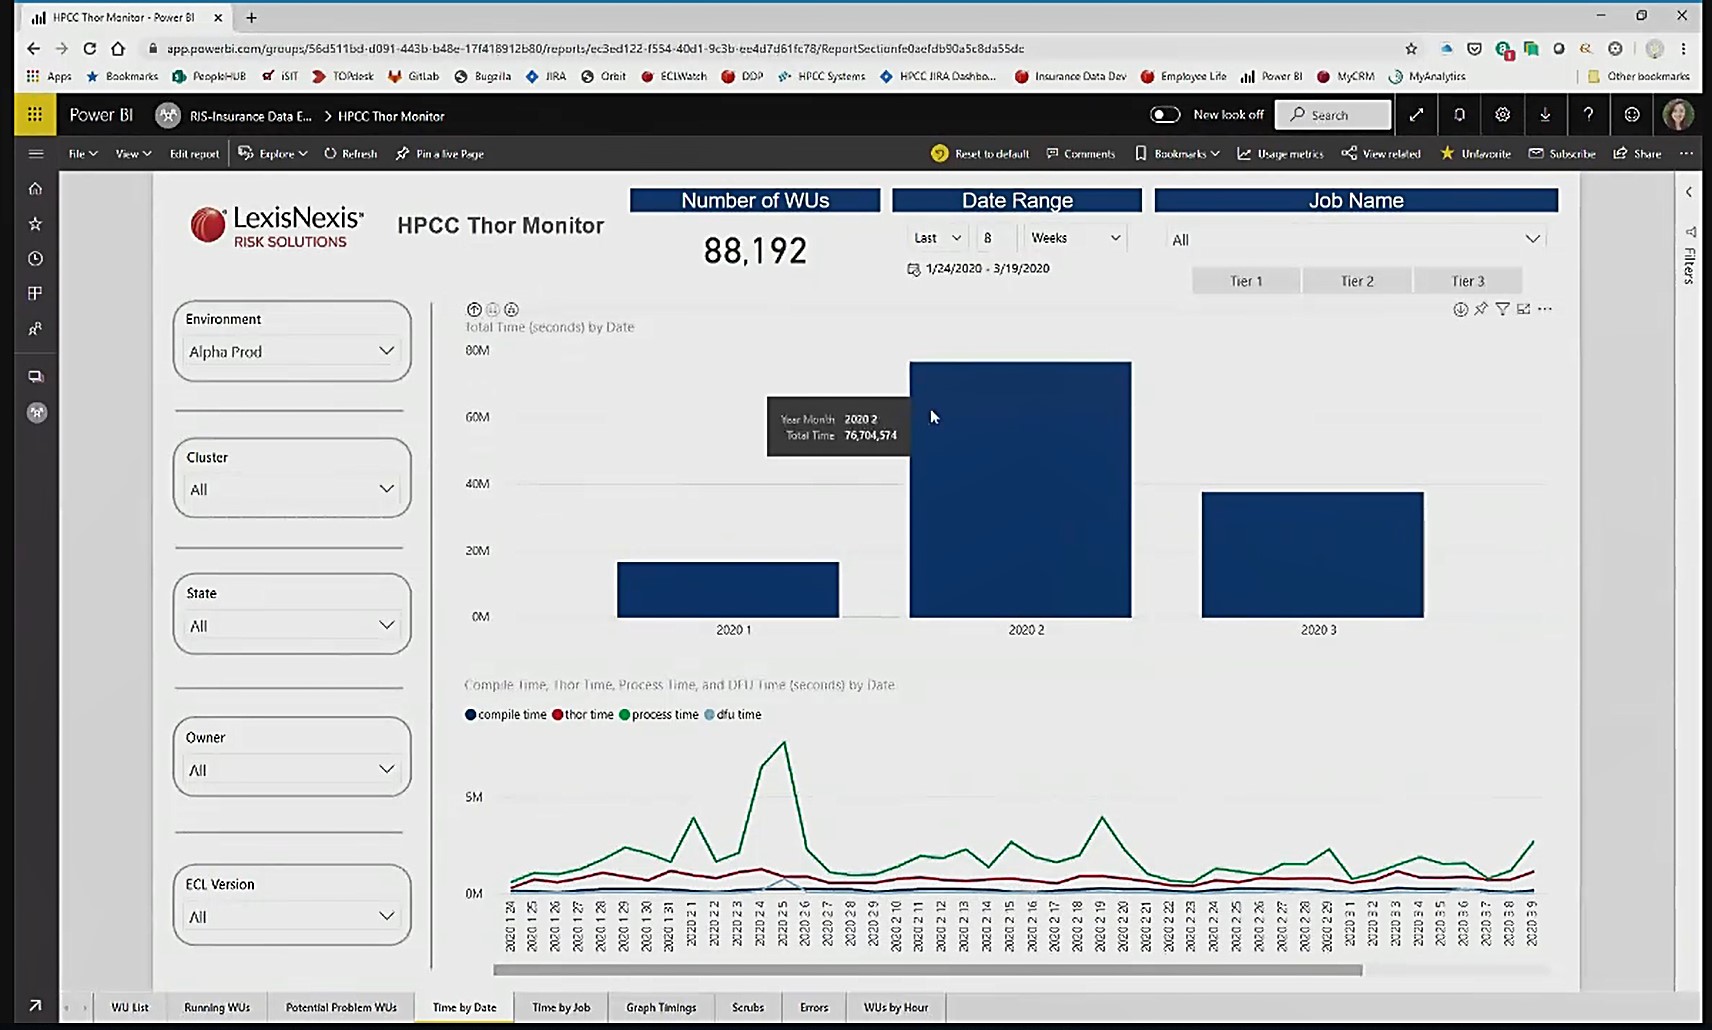
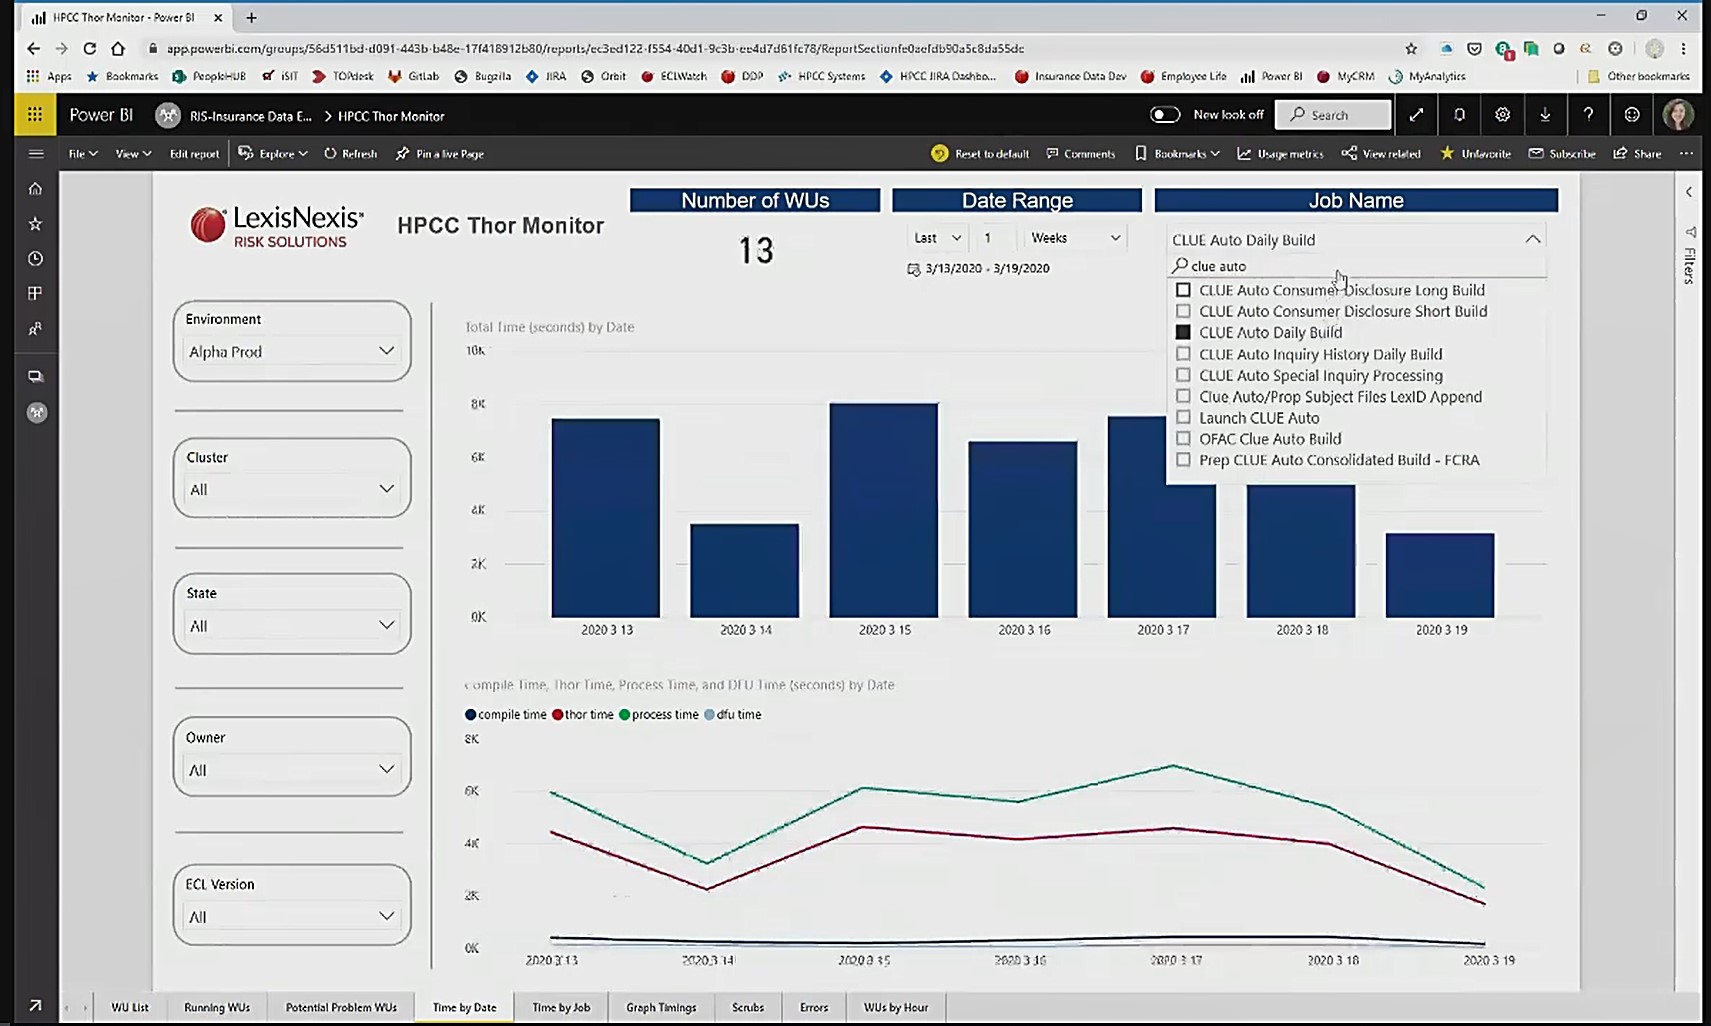
Image 7 shows workunits filtered to a specific “Job Name.”
This view has been filtered to job name “CLUE Auto Daily Build.”
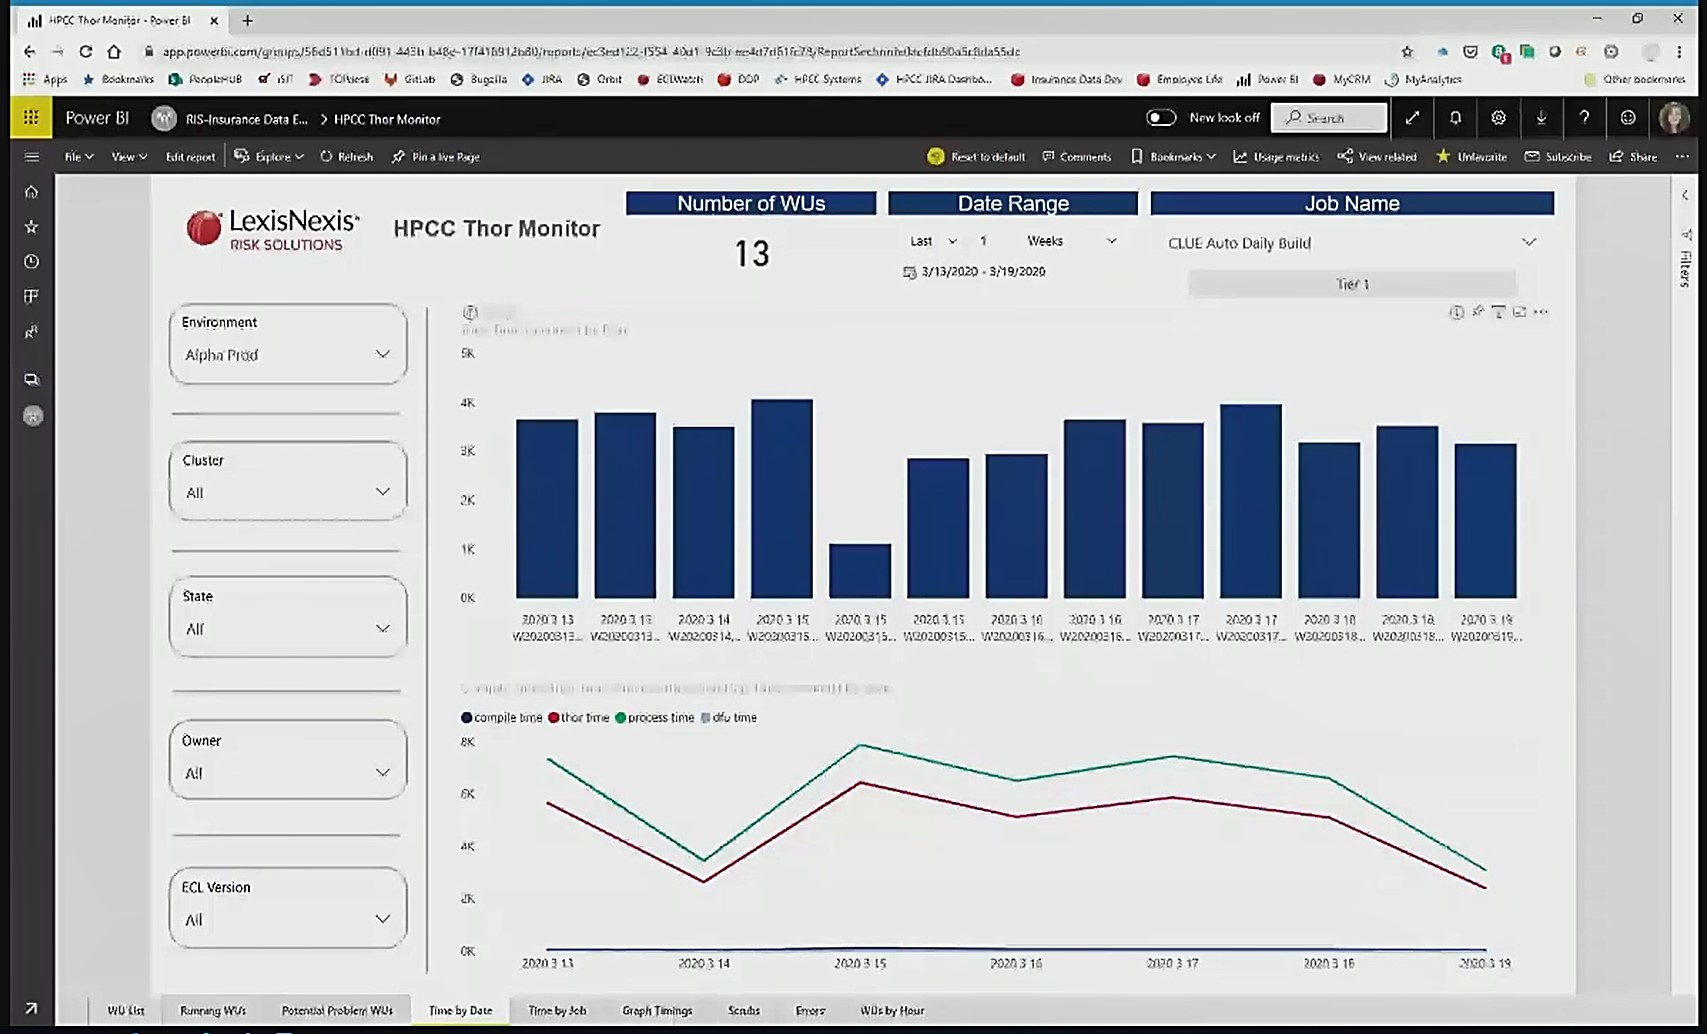
In Image 8, data is filtered to show runtimes by workunit.
Graph Timings
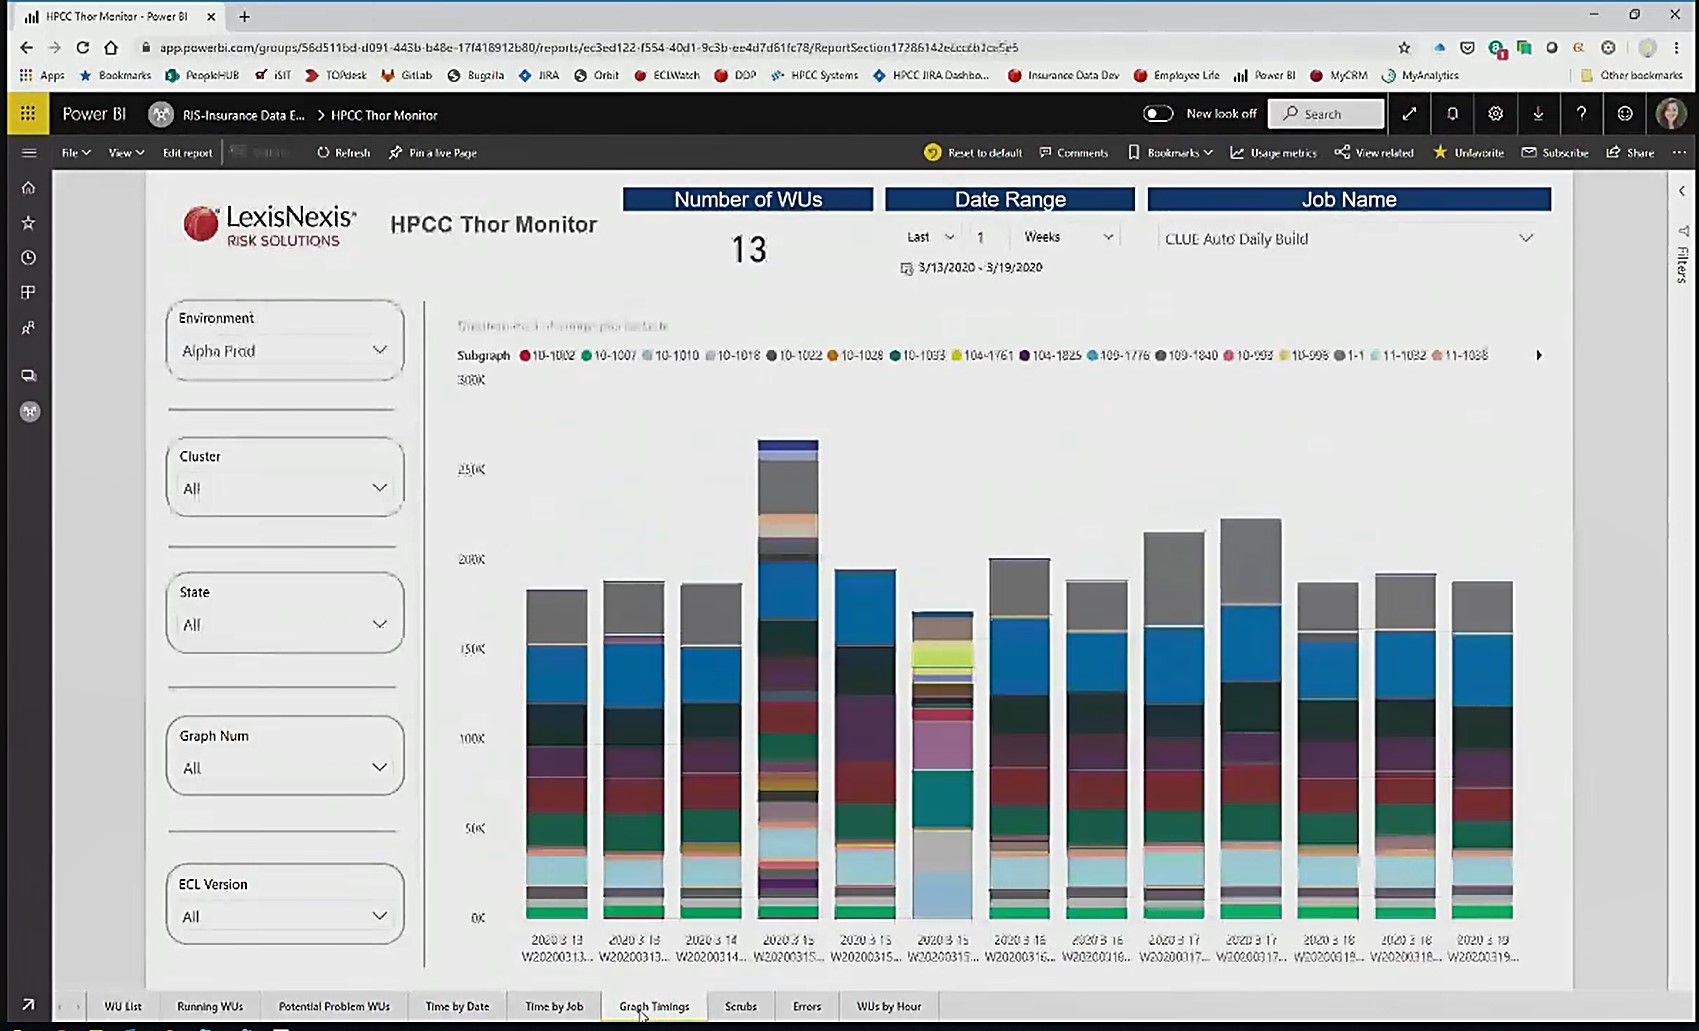
The page in image 9 allows the user to compare “Subgraph” timings for a job, over time, to investigate issues.
The job name filter, “CLUE Auto Daily Build” was retained when changing pages, so this view shows the workunits for that specific job name.
The bar shows the total time for a specific workunit, and each color in the bar shows a “Subgraph” duration. This allows for side-by-side comparison of how subgraph timings have changed.
The off-color bar near the middle was restarted at a different point, so the graphs do not line up.
In image 10, hovering over a specific area on the graphs allows the user to see information about that subgraph.
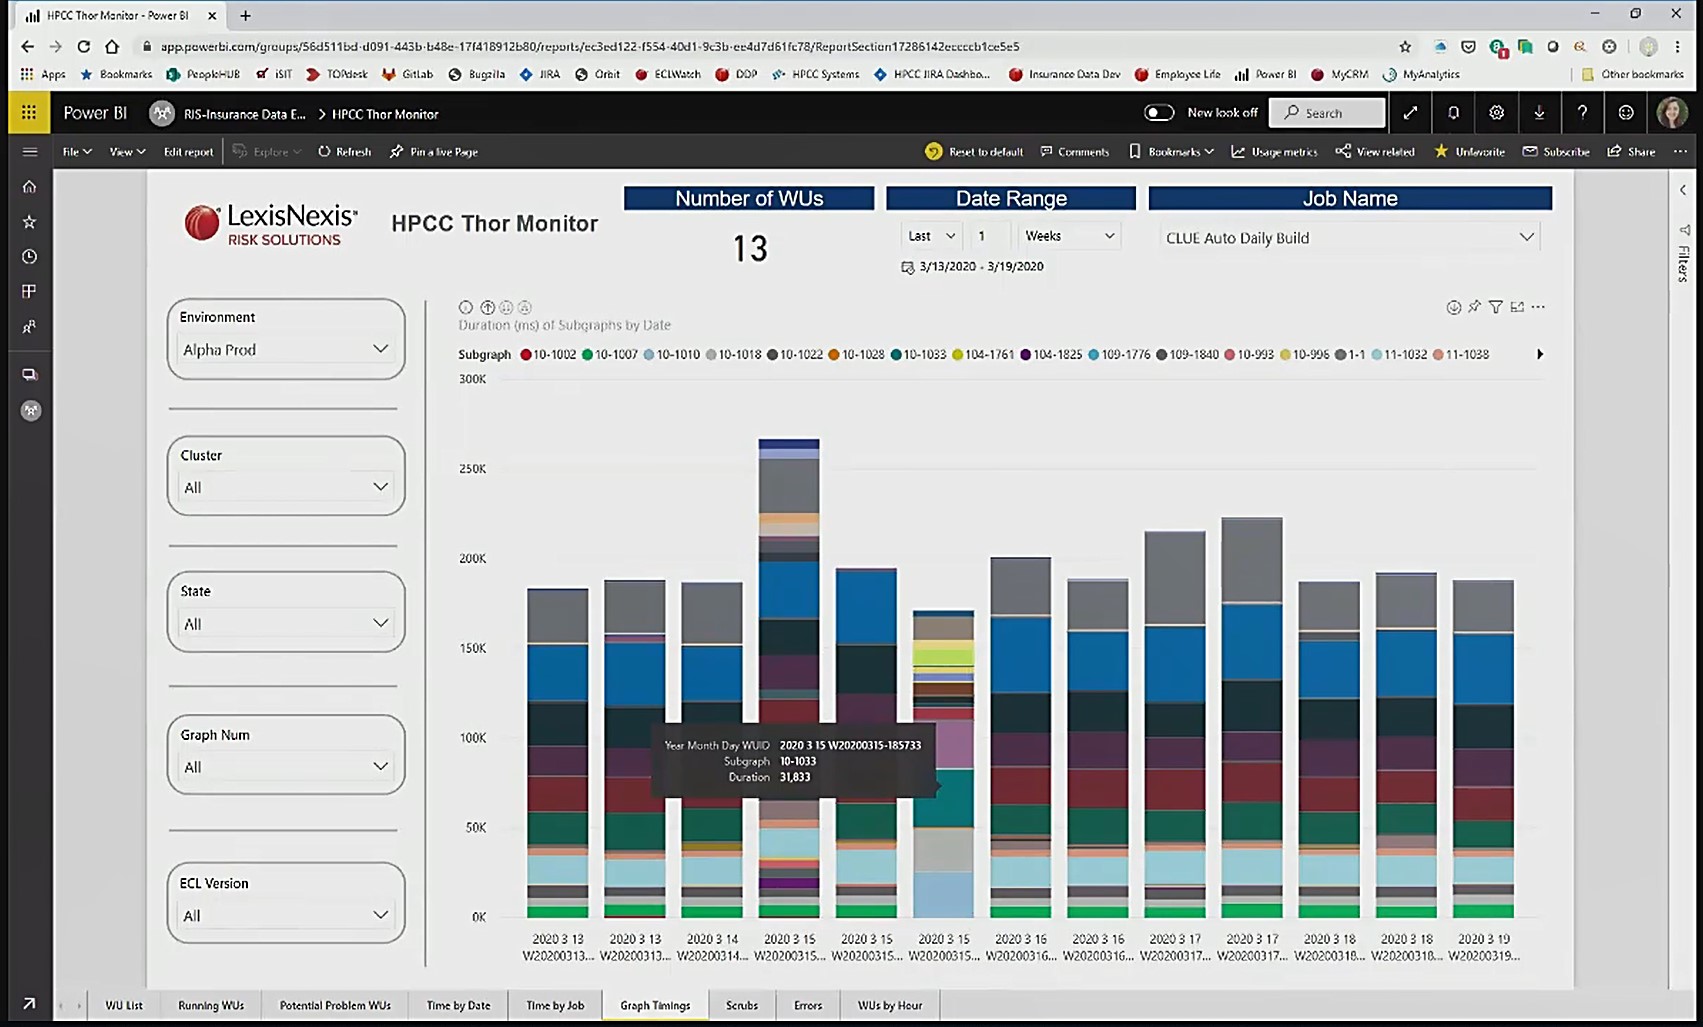
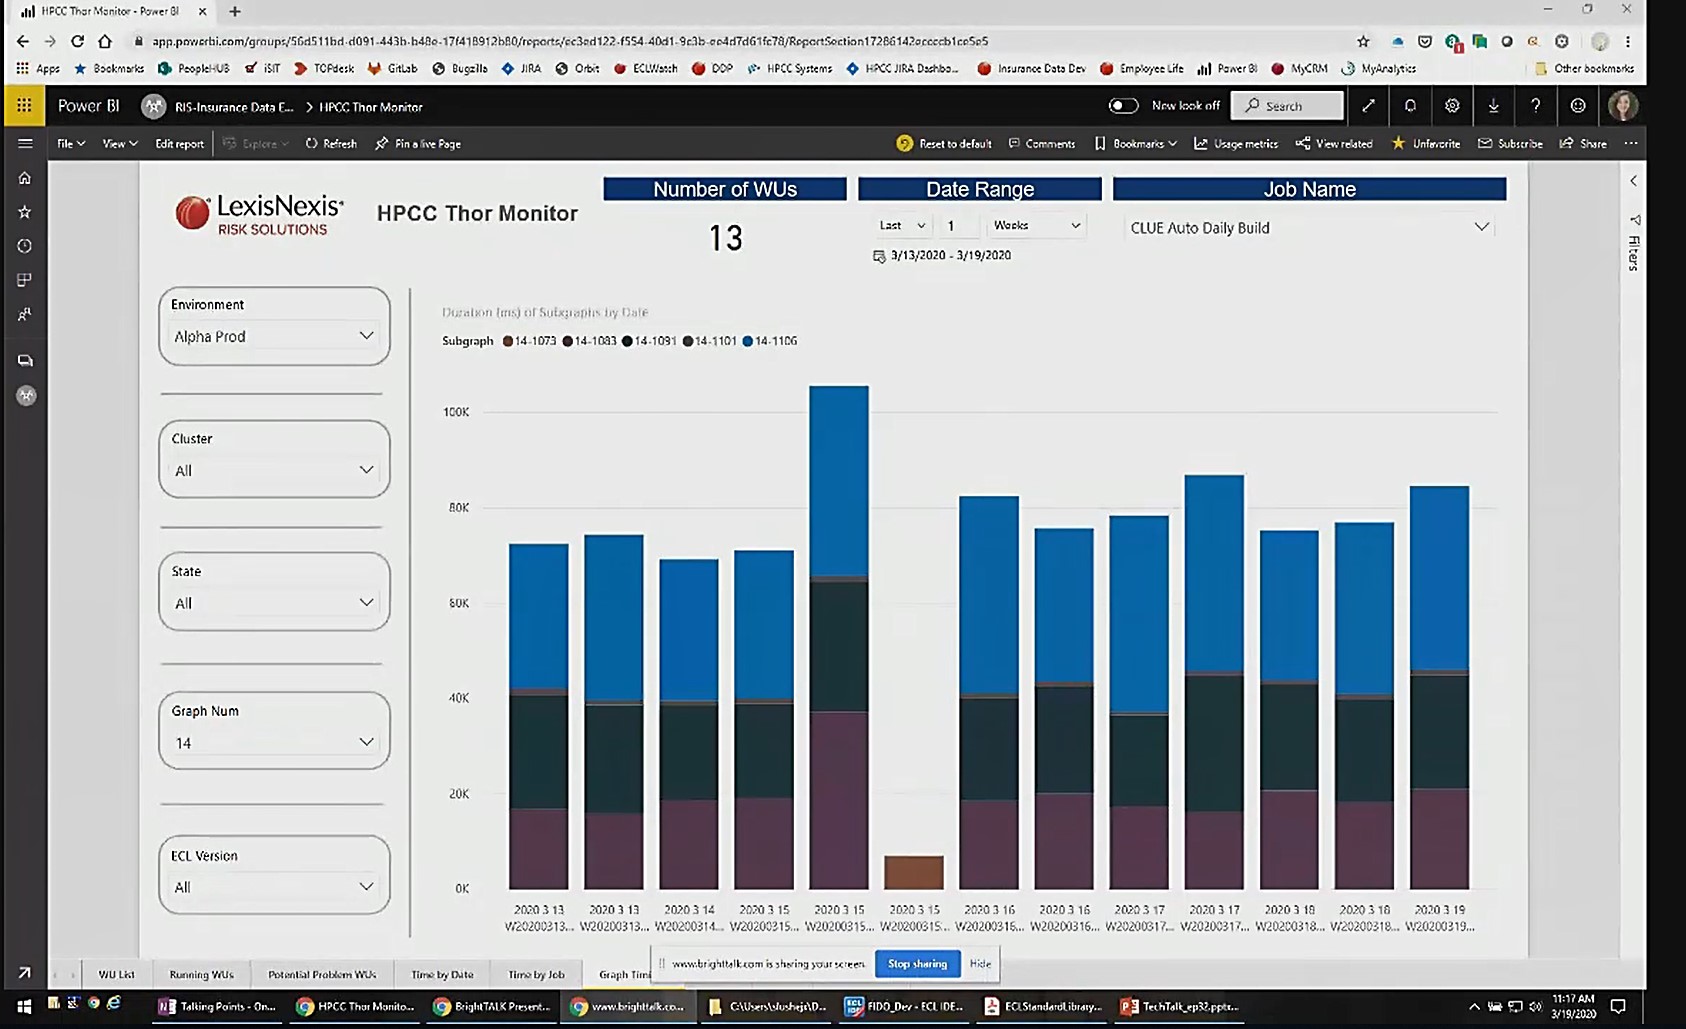
Image 11 shows a filter for graph 14.
This allows for a clearer view of the subgraphs.
Error Page
Image 12 is a view of the error page showing all jobs.
The right side of the page shows workunits with error (“WUs with Error”), by count and percentage.
Out of the total number of workunits run for the specified date range (3/13/2020 – 3/19/2020), 147 have failed, which is an error rate of 1.49%.
The pie chart shows errors by error codes, which allows the user to see which errors occur most often.
The chart near the top shows the job names with at least one error, by total number of workunits (“Total WUs”), workunits with errors (“WU’s with Error”), and the percentage of workunits with errors (“% with Error”).
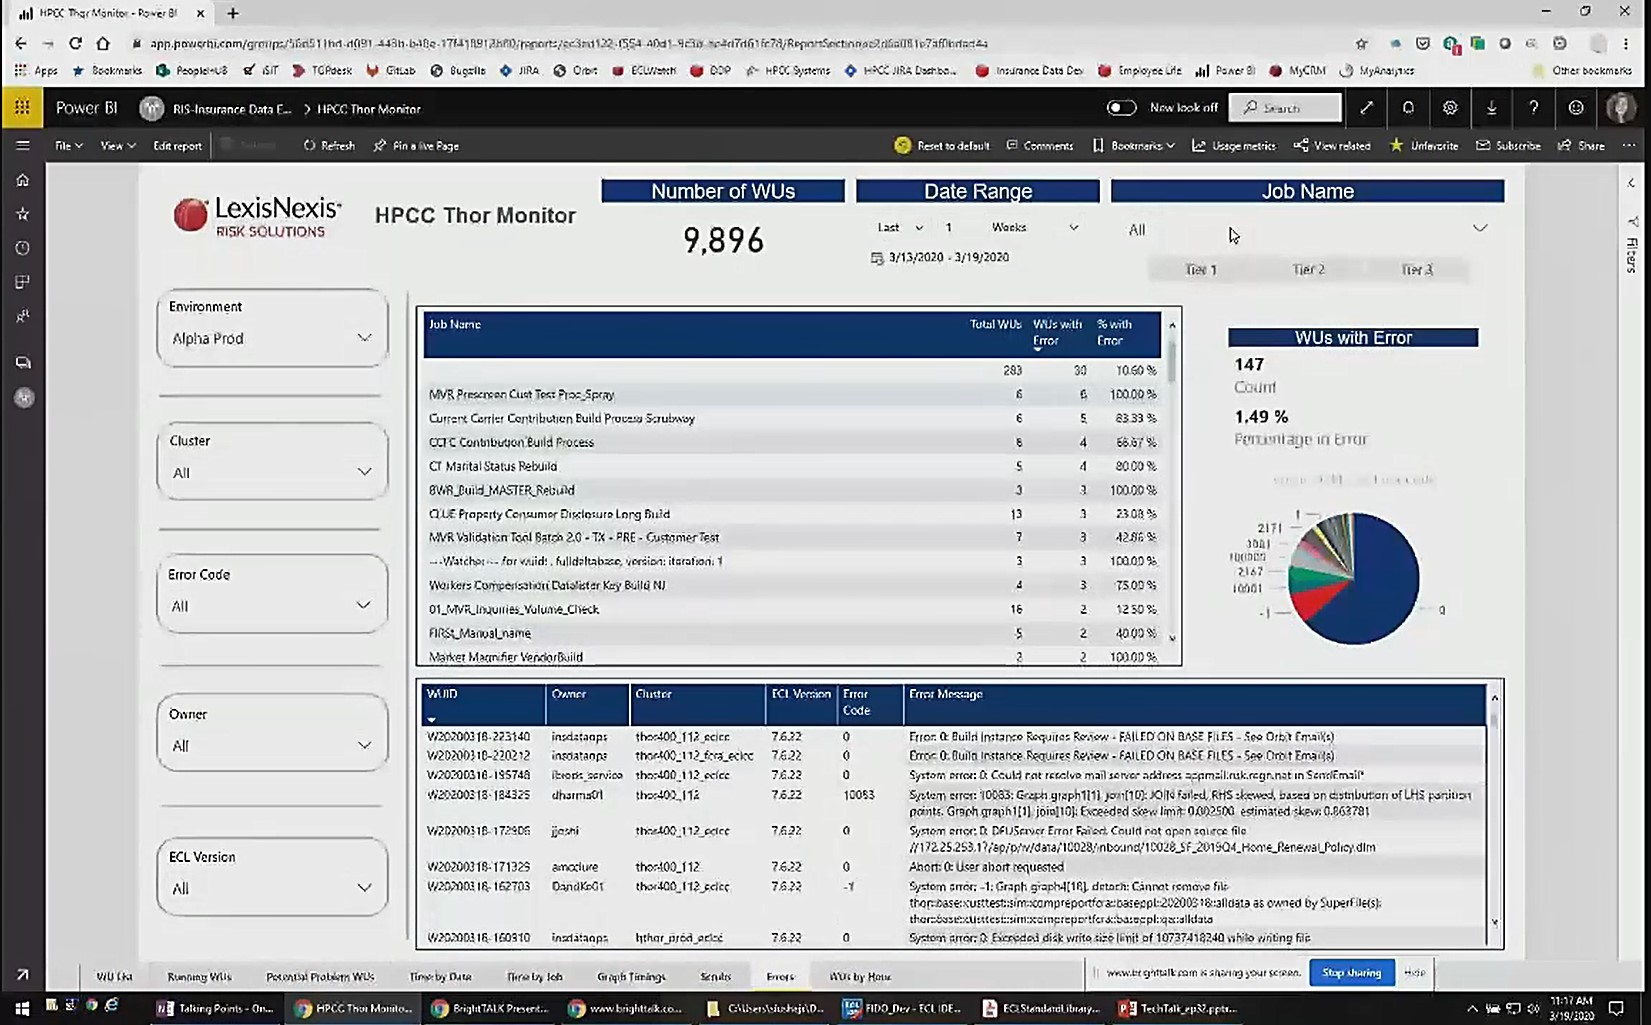
In image 13, when a specific Job Name is selected in the top chart, the bottom chart shows the workunit (“WUID”) and the corresponding error message (“Error Message”), along with the “Owner,” “ECL Version,” and “Error Code.”
Now, let’s discuss the standard workunit services standard library functions used to collect the data that supports the monitor.
Workunit List
std.system.workunit.WorkunitList
The workunit list function:
- Returns a list of workunit IDs “WUIDs” with details including state, cluster, owner, and job name
- Allows the user to set parameters to collect the list of WUIDs based on attributes
STD.System.Workunit.WorkunitList ( lowwuid [ , highwuid ] [ , username ] [ , cluster ] [ , jobname ] [ , state ]
[ , priority ] [ , fileread ] [ , filewritten ] [ , roxiecluster ] [ , eclcontains ] [ , online ] [ , archived ] [ , appvalues] }
For example, a user can pass a username parameter and only get workunits for that specific user. The user can also specify whether or not to return workunits that have been archived.
In this example, the low workunit ID “lowwuid” and high workunit ID “highwuid” parameters are used to capture a list of non-archived WUIDs that have run on Thor within a date/time range. The user passed the start date of the low workunit ID and the end date of high workunit ID. The result is a list of workunits that have run in that range.
Workunits := std.system.workunit.WorkunitList (‘W’ + startDate + ‘-000000’, ‘W’ + endDate + ‘-999999’)’
When there are a list of specified workunit ID’s, other functions can be used to get details about those workunits.
Workunit Timings
std.system.workunit.WorkunitTimings
Output
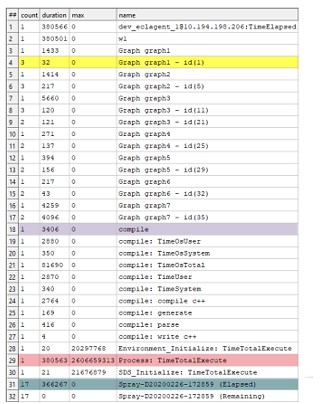
The workunit timings function returns time spent in each step for a given WUID.
The graph on the right shows how this function reports the graph timings.
The information in the graph was parsed to collect the duration for each graph and subgraph, to support the graph timings page, as discussed earlier.
- Time spent in graph 1, subgraph 1 is highlighted in (yellow)
- If the WUID ran on hthor, name may look different (like w1: graph1: sg1), so the user used two regular expressions to pick up either value.
- Compile time is highlighted in (purple)
- Processing time is highlighted in (pink)
- DFU time is the sum of entries with Spray or despray in the name is highlighted in (teal)
Workunit TimeStamps
std.system.workunit.WorkunitTimeStamps
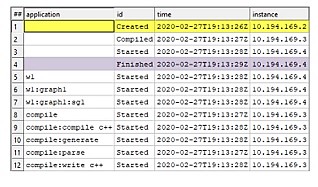
The workunit timestamps function returns timestamps for steps in the given workunit ID.
- Start time is the earliest time with “id” showing as “Created” and an empty “application” value (in yellow)
- End time is the latest time with “id” showing as “Finished,” and an empty “application” value (in purple)
- here may be more than one “finished” time, so be sure to sort the data to capture the latest time.
Workunit Messages
std.system.workunit.WorkunitMessages
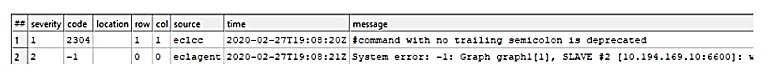
A workunit message function:
- Returns any messages associated with a given WUID
- Includes informational messages, warnings, and errors. Errors have a severity of 2
A WUID may have more than one message. It can have an informational message, as well as an error message. There can also be multiple error messages associated with the workunit ID.
Example: Code
In this example, the user uses workunit services functions to capture error messages for all workunits that ran between February 26, 2020 and February 27, 2020.
- First, a list of workunits is captured in the date range using the WorkunitList function.
- The list is then projected and the other workunit service functions are called within the “transform” to create child datasets, with the timing, timestamp, and message details for each workunit.
- If you’re not running on “hThor,” wrap the workunit services call in “noThor,” because workunit service functions cannot run from a Thor slave.
- Once the list of workunits has been created, the messages from the child dataset are normalized, messages that are not errors are skipped over, and newlines and tabs from the messages are stripped.
/*************************************************************************************************
Get Workunit list with child datasets for WorkunitTimings,
WorkunitTimeStamps, and WorkunitMessages
*************************************************************************************************/
export getWorkunitList(unsigned4 startDate, unsigned4 endDate) := function
workunits := std.system.workunit.WorkunitList(‘W’ + ‘-000000’, ‘W’ + endDate + ‘-999999’);
wuListLayout getWUList (recordof (workunits) L) := transform
self.wuTimings := std.system.workunit.WorkunitTimings(trim (L.wuid, right, left));
self.wuTimestamp := std.system.workunit.WorkunitTimestamps(trim (L.wuid, right, left));
self.wuMessages := std.system.workunit.WorkunitMessages(trim (L.wuid, right, left));
self := L;
end;
//Workunit Services can not run from a thor slave, so wrap in nothor
return nothor (project (workunits, getWUList (left)));
end;
/**********************************************************************************************************
Get error messages for the provided workunit list.
**********************************************************************************************************/
export getErrMsgs (dataset (wuListLayout) wuList) := function
errMsgLayout normMsgs (wuListLayout L, WsMessage R) := transform
self.wuid := if (R.severity = 2, L.wuid, skip) ; // Only keep error messages
self.message := regexreplace (‘ (\\n\\t) ‘, R.message, ‘ ‘ ); // Strip newlines and tabs
self := R;
end;
return normalize (wuList, left.wuMessages, normMsgs (left, right));
end;
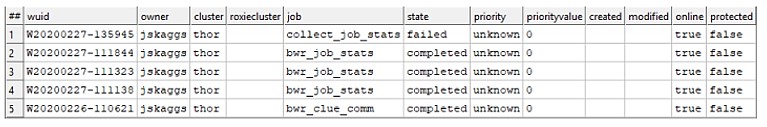
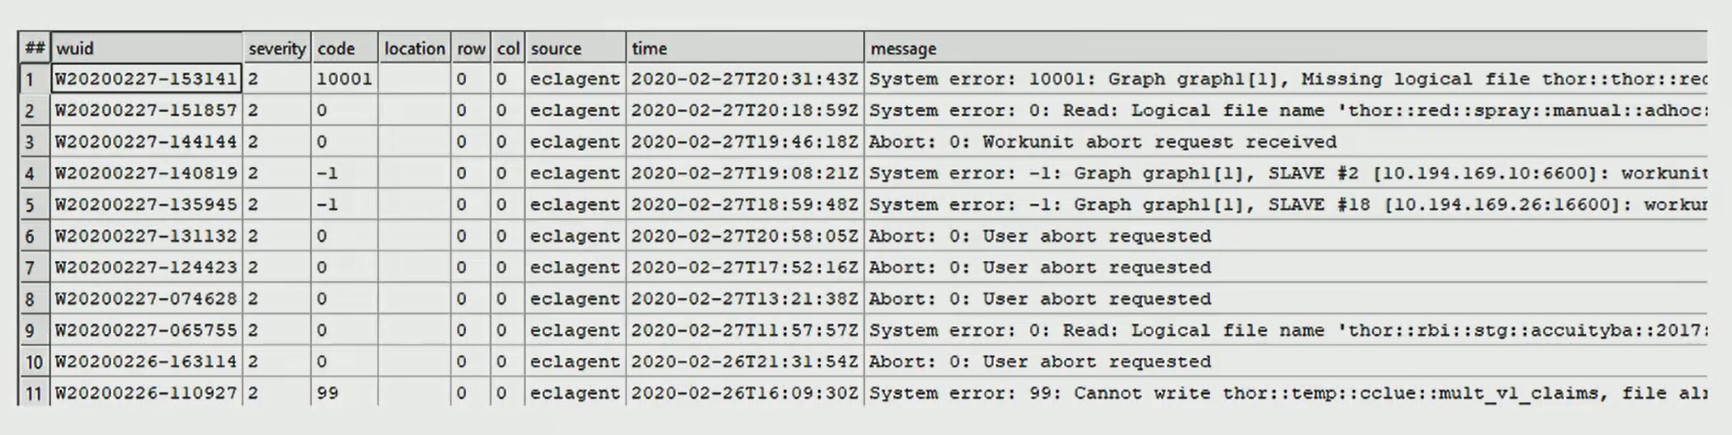
// Output the error messages for WUIDs run on Thor 2/26 – 2/27
wuList := getWorkunitList (20200226, 20200227);
output (getErrMsgs (wuList));The output is a dataset that shows error messages for all workunits that ran between 2/26 and 2/27.
So far, we looked at a demo of the HPCC Systems Thor Monitor in Power BI and learned about Workunit Services standard library functions. Now, let’s look at how data flows from Thor to Power BI.
Getting Data to Power BI
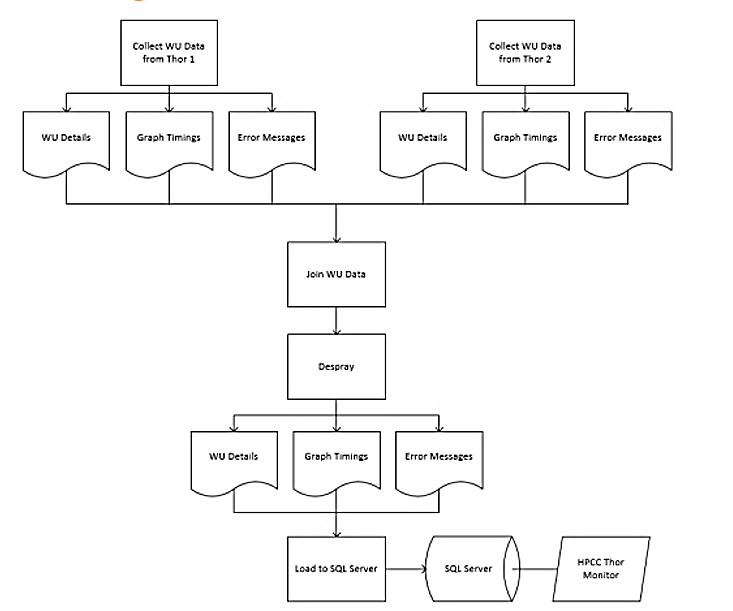
There are a number of steps involved in getting data to Power BI. They are the following:
Step 1 – Data is collected from multiple Thor environments, so ECL code using workunit services functions are run on each of the Thor environments to collect that data. This results in an output of three (3) datasets. One dataset has a list of workunit ids and the details from workunitlists and workunittimings. One dataset contains graph timings for all of the workunits, with one record for each subgraph. And another dataset shows the error messages with one record for each error message.
Step 2 – There is ECL code that is running on one of the Thor environments that collects the data from each of the other environments, combines it all together, does some minor transformations, and joins it with the historical data.
Step 3 – ECL desprays the data to a server where a script picks it up and loads it to SQL server.
Step 4 – Once it’s in the SQL server tables, Power BI connects to SQL server and picks up the data. Power BI recognizes the relationships between the tables and allows for creation of visualizations.
Summary
In this blog we looked at how the ECL Workunit Services standard library functions are used to capture details about workunits running on Thor. These details included processing time, errors, current state, and other data points. We also examined the flow of this data from Thor to Power BI, and looked at how this information can be used for monitoring, trending, error analysis, degradation, and other data points that can help improve Thor environment efficiency.
Future work includes adding additional monitoring features.
About Jessica Skaggs
Jessica is a Consulting Software Engineer at LexisNexis Risk Solutions. She has been with LexisNexis Risk Solutions since 2001. Jessica spent 16 years as a  developer and technical lead with the Legal & Professional division, before moving to her current role, when she began learning about and working with HPCC Systems, ECL, and Power BI. Jessica has a Bachelor of Science degree in Systems Analysis from Miami University (OH).
Acknowledgements
A special thank you to Jessica Skaggs for her amazing presentation, “HPCC Systems Thor Monitor – Using Workunit Services and Power BI to Monitor Thor Activity” at HPCC Systems Tech Talk 32, and her contributions and guidance for this blog post.