Using HPCC Systems with Elastic Stack for log visualization and management
The following blog is a confluence of work from 3 contributors to the HPCC Systems community. In its infancy this work started with Nathalia Ribas as a student under Professor Plentz where they conceptualized and began work on this project alongside Alysson Oliveira of LexisNexis Risk Solutions with the intent to research and test the use of Elastic Stack with HPCC Systems.

Nathalia Ribas is a Computer Engineering student at the Federal University of Santa Catarina (UFSC), Brazil. She was introduced to HPCC Systems in 2021 when she had the opportunity to study the HPCC platform in the cloud along with Elastic Stack for her Undergraduate Research, being oriented by Alysson Oliveira and Hugo Watanuki. She participated in the 2022 HPCC Systems Poster Contest with the poster entitled: HPCC Systems Log Monitoring in the Cloud and won the Best Poster Community Choice Award. In this blog, Nathalia will speak about the dashboard developed during her research and introduce Kibana’s tools and possibilities.

Alysson Oliveira is a Software Engineer at LexisNexis Risk Solutions. His main role revolves around support, development and delivery of training programs for the HPCC Systems in the Brazil region, covering the academic audience, computing and data professionals and researchers. He also works to stablish partnerships with universities to offer undergraduate students the opportunity to work on scientific projects.

Professor Patrícia Plentz is an Associate Professor at the Federal University of Santa Catarina (UFSC). She graduated with a Ph.D. in Electrical Engineering from UFSC and is currently at the Distributed Systems Research Laboratory and also at the Robotize Research Group. The main research domains she focuses on are: distributed and real-time systems, tactile internet, scheduling algorithms and temporal constraints for navigation of mobile robots
Analyzing log files is a very manual task and can take plenty of time according to how many components a system has. To facilitate this essential activity and turn it more intuitive, we propose using Kibana’s dashboards. Dashboards are a more visual way of doing log analysis, and it may be better to understand what is happening in the system and explain it to the team.
Before you start
– Make sure you have an HPCC Systems environment running. Otherwise, you may read this blog to set it up.
– Read Rodrigo Pastrana’s blog about how to set an Elastic Stack environment for HPCC Systems.
Elastic Stack
Elastic Stack offers multiple log management and visualization tools. The ones we use are Elastic Search, Filebeat, and Kibana.
Elastic Search: it’s the search and analytics engine. Check the Elastic Search Guide for more information about this tool.
Filebeat: provides the log centralization. Check Filebeat Guide for more information about this tool.
Kibana: it’s an Elastic Stack interface. With Kibana, we can search logs by message or components, create log visualizations, and many other tools to explore and analyze our log data. Check Kibana Guide for more information about this tool.
Dashboard overview
The dashboard has seven components; a counter of occurrences; three tables: one for workunits, one for system components, and the other for messages; two pies charts: one for events by system component, the other for events by day; and an area graphic for showing the number of occurrences by hour.
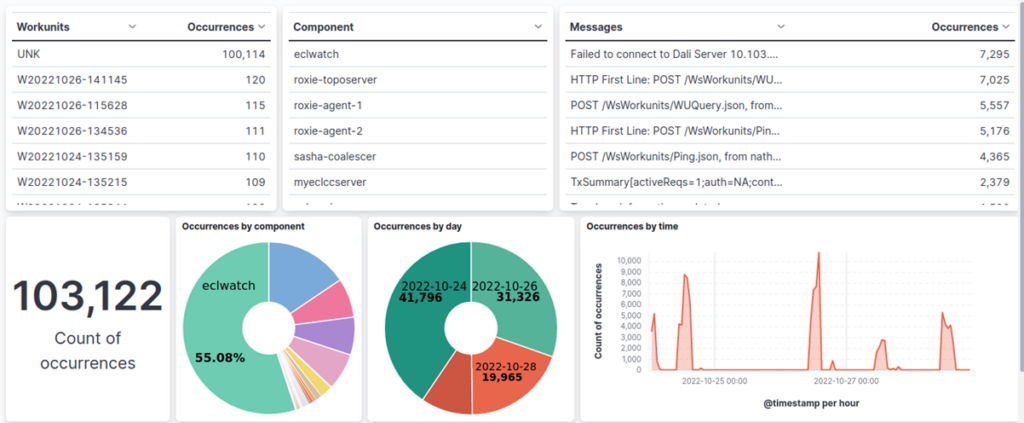
These components were chosen according to the needs felt during the test. The dashboard is constantly being improved, and feedbacks and suggestions are strongly encouraged, so feel free!
New to Kibana? Set up an Index Pattern
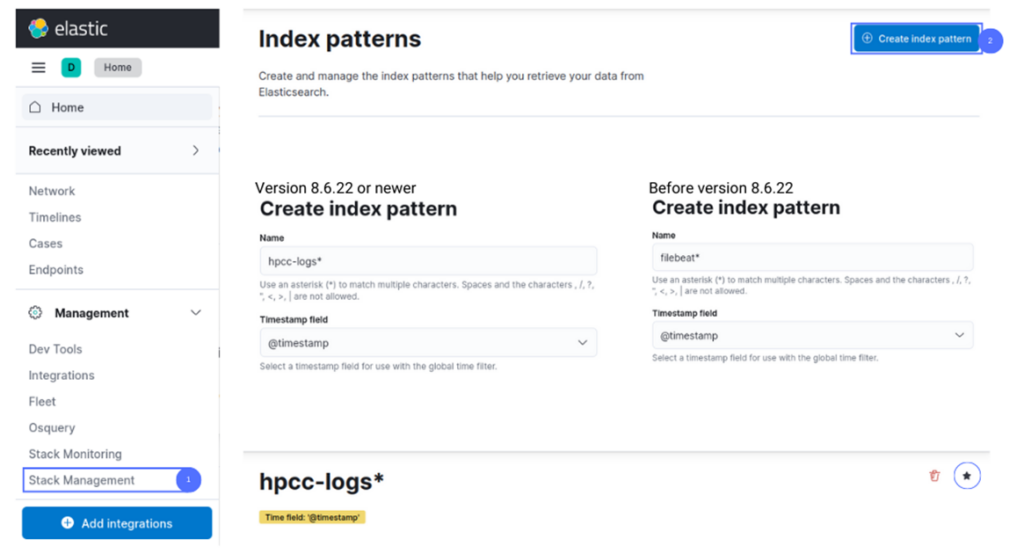
If you are new to Kibana and have just installed it, you should read this before starting the tutorial. Kibana points to your data using index patterns, and you need to check if you have the right one once you have installed the application. Follow the steps below to conclude.
- On the Kibana interface, click on the Hamburger icon (☰).
- Scroll until finding the “Management” tab and click on “Stack Management”.
- On the “Kibana” section, select “Index Pattern”.
- On the list, make sure you have either “hpcc-logs*’ or “filebeat*”. If you do, it’s all fine!
Note: if your HPCC System version is older than 8.6.22, you will need a “filebeat*” pattern. If your HPCC System version is post 8.6.22, it’s a “hpcc-logs*” pattern. Both models are shown below.
- Otherwise, click on “Create index pattern”.
- In the “timestamp field” area select “@timestamp”, then click on “Create index pattern” to confirm
- Once you have created your index pattern, click on the little star to define it as default.
How to create a Kibana Dashboard
This blog will explain how to create the Dashboard presented in the “Dashboard overview” section, but feel free to explore the platform and change whatever you want.
- Access the Dashboard item in the “Analytics” section.
- Click on “Create dashboard”.
- Click on “Create visualization”.
Workunit table:
- Select the type as “table”.
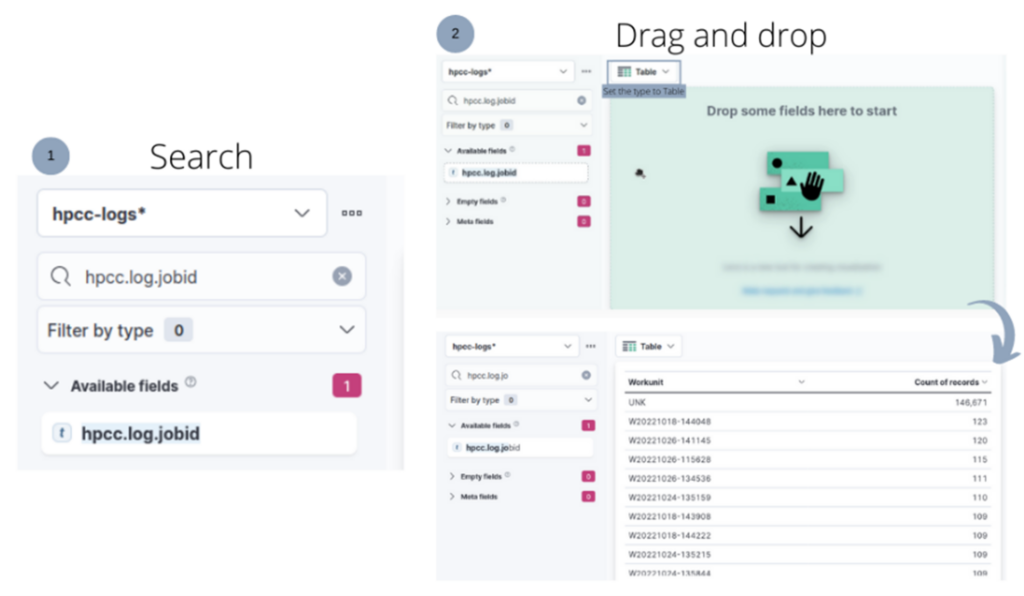
- In “Search field names” search for “hpcc.log.jobid”, drag and drop in the middle section, where indicates.
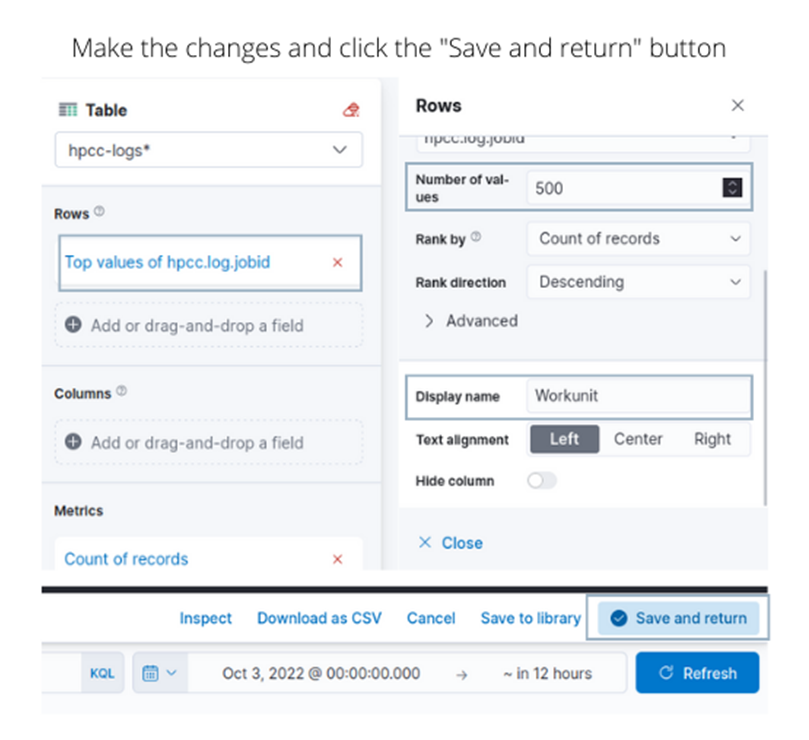
- You can increase the number of values shown in the table. On the right panel, in “Rows”, click on “Top values of hpcc.log.jobid”. In the “number of values” option change the number according to what you want.
- Conclude your edit by clicking on the “Save and return” button.
- On the main page, adjust the visualization with the size and position that is better for you.
- Component table:
- Select the type as “table”.
- Search for “kubernetes.container.name”, drag and drop in the middle section.
- Again, you can personalize as much as you want, changing the number of values or the display name.
- In the middle section, click on “count of records” and hide it.
- Messages table:
- Select the type as “table”.
- Search for “hpcc.log.message”, drag and drop in the middle section.
- Personalize as you want.
- Count of occurrences
- Select the type “metric”
- Search for “Records”, drag and drop in the middle section.
- You can change the name by clicking (in the right panel) on “count of records” and looking for “display name”.
- Occurrences by component
- Select the type “pie”
- Search for “kubernetes.container.name”, drag and drop in the middle section.
- You can increase the amount of components visualization by clicking on the item in “slice by” section, then changing the number of values.
- Occurrences by day
- Select the type “pie”
- Click on “add or drag-and-drop a field” in the “size by” section. Select the function “count”.
- Closing the last part, click on “add or drag-and-drop a field” in the “slice by” section. Search for the “@timestamp” field.
- Check the option “customize time interval” and change it to “1 day”

- Occurrences by time
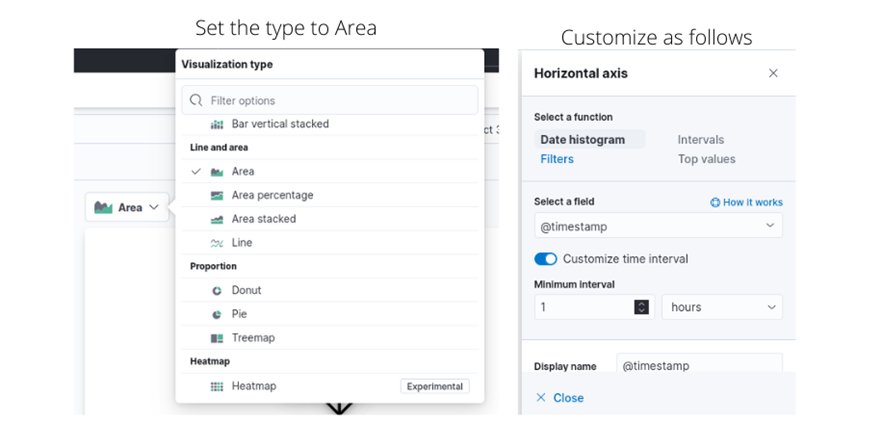
- Select the type “area”.
- Search for “@timestamp” in the left panel. Drag and drop in the middle section.
- Go to the “horizontal axis” in the right panel and customize the time interval as you want. Let’s select 1 hour of time period as an initial step.
Your dashboard is done! Now, you can personalize as you want. Kibana has a lot of features for dashboards, for example: you can add a text explaining your dashboard or information you find pertinent for your team. Also, it’s highly recommended to add some titles to your components, it makes your dashboard clearer to the others.
You can check these and other dashboard features in this Kibana’s guide.
How to import and export Kibana dashboards
Another feature Kibana offers is the possibility to import someone’s dashboard layout and/or share your own. Follow the steps below to import and export a dashboard. You can click here to download my dashboard and test the import feature!
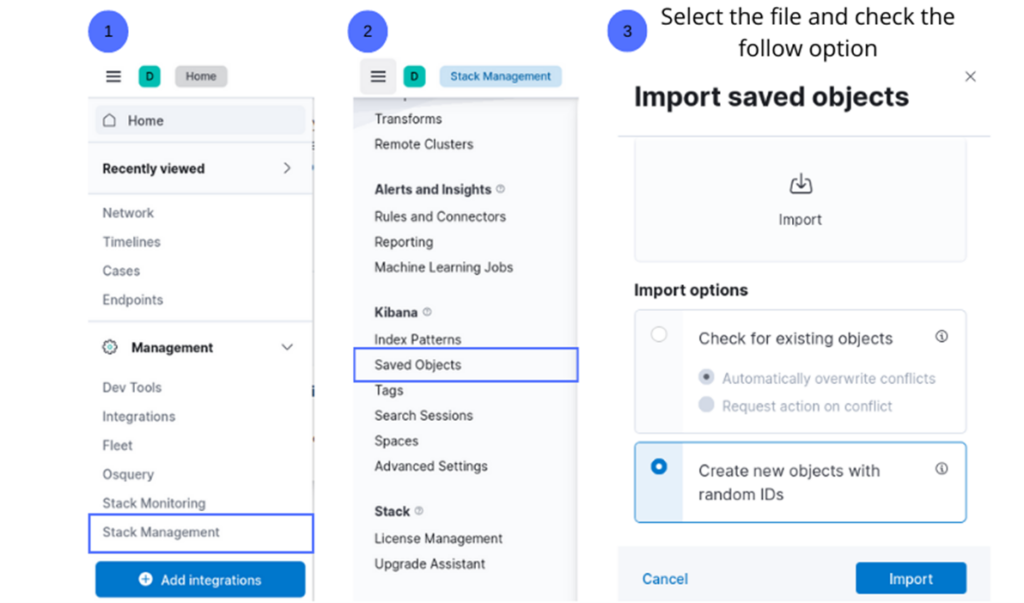
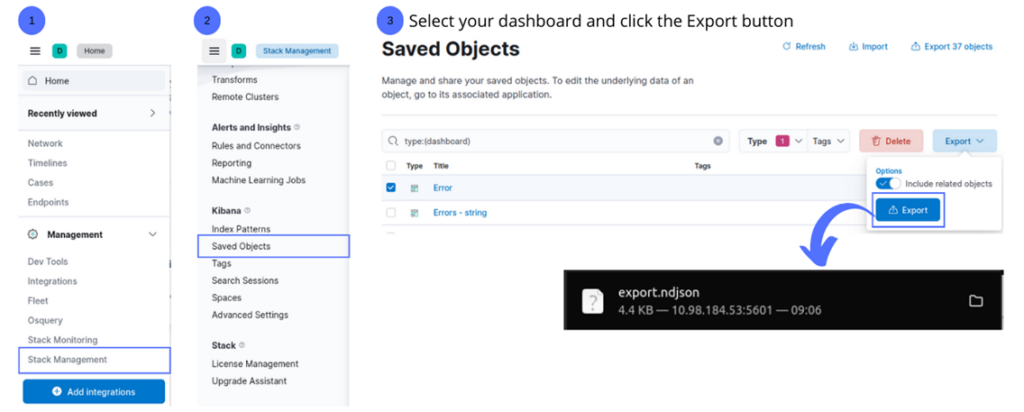
- On Kibana interface, click the Hamburger icon (☰).
- Scroll until finding the “Management” tab and then click on “Stack Management”.
- On “Kibana” section, select “Saved Objects”.
Import a dashboard
- Click on the “Import icon” as shown below.
- Select the file you downloaded.
- Check the “Create new objects with random IDs” option.
Export a dashboard
1. Find the dashboard you want to export. You can use the search section or filter by type.
2. Select the object by clicking the square.
3. Click the “Export” button.
Now that you’ve completed the steps above, you should be able to create many different dashboard styles, choose which one is best for your context, and it will help a lot to visualize the logs!
Additional information
Here are some helpful links to explore more about HPCC Systems with Elastic Stack
