Performance Improvements in HPCC Systems 6.4.0 – Under the hood
As soon as I hear the phrase ‘this release includes a number of performance improvements’, my curiosity always gets the better of me leading me to ask questions such as, what exactly does this mean, where will users see these improvements and how do we know the system is performing better than before? So, having asked these questions of our platform development team about our newest release, HPCC Systems 6.4.0, I want to share the answers with you.
I guess the easiest answer to my first question is that performance enhancements generally mean that your query will run faster. But there’s often more to it than that, because the changes may relate to a specific set of circumstances or type of query which may or may not affect you. So, let’s take a more detailed look at the most notable performance improvements and find out what they may mean to you.
Compiler optimization highlights
We have introduced a new fast syntax check option in the eclcc compiler, which means that your query will syntax check faster and use less memory while doing so. This is good news for local repository users, particularly those wanting to syntax check and/or create archives of large and complicated ECL. Fast syntax check currently works with all ECL constructs except the most obscure ones. We expect to implement those in HPCC Systems 7.0.0. and at this point, fast syntax check will be the default option. The improvement in memory usage from this enhancement will be significant for users who are running on a Windows machine and still using the 32-bit compiler.
Windows users should also note that we now supply a 64-bit version of the Windows Client Tools (which includes the eclcc compiler). The good news here is that this lifts the 3GB memory restriction. So, if your machine has more memory than this, it will now be able to use it.
By looking at where the compiler spends most of its time when a user reports an issue, it is sometimes possible to isolate potential bottlenecks and implement simple optimization solutions for queries that look to be running a little slower than we would like. So for example, in HPCC Systems 6.4.0, we have implemented an optimization for queries which spend a lot of time resolving expressions and cursors in the current context. We have also minimized the number of times an expression is transformed to reduce compile time. Optimizations have also been made to the generated code for count(x) >n and constant sets, which help speed up query run time.
You may be interested in the new FEW option to the LOOP function, which is useful when using complex loops processing small amounts of data, which otherwise cause excessive and unnecessary memory overheads. More details about the usage of this new option, is available in the HPCC Systems ECL Language Reference.
Roxie, Thor and ECL Watch optimization highlights
Since Roxie is index based, it will come as no surprise when I say that most of the optimizations in this area are related to index reads. In some cases, we are simply removing a bottleneck and the happy side effect is improved Roxie performance. This is true in the case of IO operations being blocked for long periods on critical sections.
If you run batch jobs on Roxie, you will be interested to hear that we have introduced a new LocalPTree call in JPTree. Typically, batch queries are relatively simple but the challenge is in pushing through as many queries as possible as quickly as possible. This new call is much faster than the previous CAtomPTree call, particularly when multiple threads are hitting it.
In HPCC Systems 6.4.0, we have implemented a proof of concept that we anticipate will make a huge difference to filtered index reads in keyed joins in Thor. Notice these two new options in Thor that you might like to test drive and report back on:
- remoteKeyFilteringEnabled (default = false)
When enabled (e.g. with #option(‘remoteKeyFilteringEnabled’, true); in a query, any non-local indexread/count/aggregate/normalize, will use this feature and access an interface to access the key data remotely via dafilesrv. - forceDafilesrv (default = false)
This option will force the use of dafilesrv for all files that would otherwise be local reads.
The idea is to push the filtering to the machine where the data is (which is, by the way, what Roxie does all the time) and only return the rows that are required, rather than reading the index remotely which involves reading a lot of unwanted data.
Also on Thor, queries that read the same file on multiple threads will be able to use all threads at the same time.
In ECL Watch, we have observed that calls to wuinfo were causing unnecessary overheads on ESP. We have removed these overheads by ensuring that it does not try to load the workunit for each wuinfo call.
The HPCC Systems Performance Test Suite
Some of these improvements on their own make a notable difference to the performance of HPCC Systems, but when combined and added to others not mentioned in this blog, the performance uplift, particularly on Roxie, should be noticeable in HPCC Systems 6.4.0. So how do we know this?
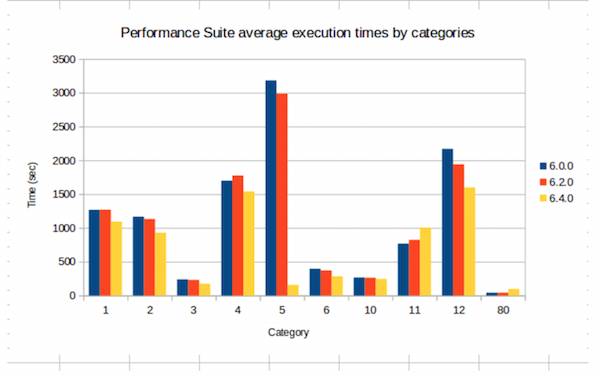
As part of our own testing, we regularly run our performance test suite to spot variations in performance on both Thor and Roxie. Our test cases (which we add to all the time as we find and resolve anomalies), help us to assess where extra work may be needed to improve or stabilize performance. The following graph shows a comparison of performance suite execution times between HPCC Systems 6.0.0, 6.2.0 and 6.4.0. Similar performance suite tests are grouped into categories in this graph, which shows that the performance suite tests in most categories run faster in HPCC Systems 6.4.0. Developers have investigated why this was not the case for two of the categories shown at the time this test was run, to identify and apply fixes:

The good, the bad and the ugly
Every night, the performance suite is run automatically against the current master branch on GitHub, to help spot whether any changes have had an impact on performance. It’s worth noting here that the impact is also tracked at the individual test level. For those who are interested, here’s a bit more information about why we use it and how it helps the HPCC Systems platform team to maintain and improve performance on a daily basis.
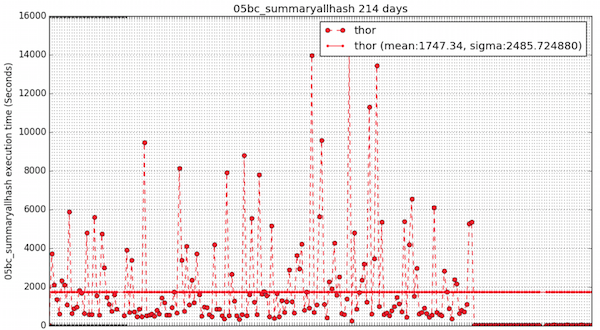
The graph below shows wild swings caused by a problem in the hash dedup activity, which could sometimes (if inputs got locked “in-step”) degrade fairly catastrophically. This issue was fixed on the 15th May 2017 and after that point, the Thor execution time line clearly becomes rather more steady and lower, indicating improved performance. This is a good example of how the performance suite helps us to identify an existing issue, while also confirming that our investigations and resulting fix have successfully resolved the problem:

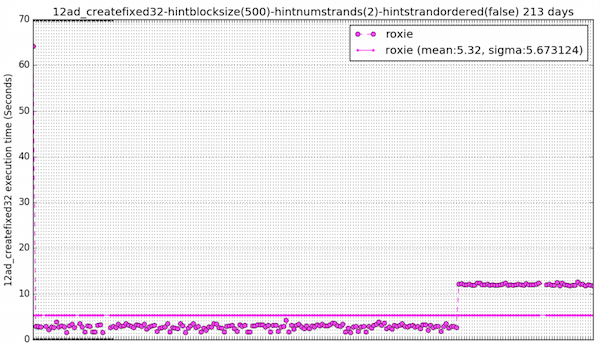
Of course, this can also work the other way. The performance suite can also quickly alert us should a new feature, enhancement or fix have an adverse impact on performance. The following graph shows the bad effect of a change that was made, clearly indicating a degradation in performance on Roxie. This is a red flag which prompts the developers to investigate why this has happened and resolve the issue:

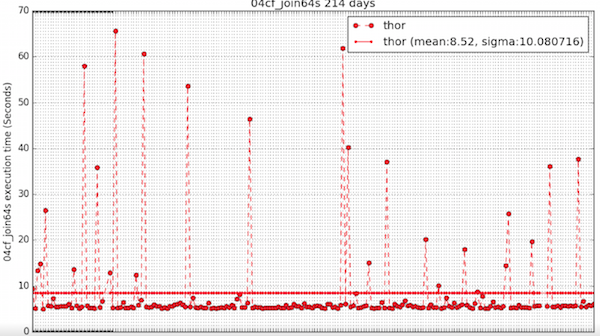
It has also proved useful in spotting some unexpected randomness in the performance of certain Thor activities, as shown in this ‘ugly’ graph. While the baseline is fairly constant, there is some random slowness going on here that needs investigating and resolving:

But it’s not just there for our use, the HPCC Systems performance test suite is available for you to run yourself if, for example, you would like to compare the performance of HPCC Systems on different hardware configurations.
Notes:
- HPCC Systems also comes with its own regression suite.
- Download HPCC Systems 6.4.0 and the supporting documentation.
- More information about HPCC Systems 6.4.0 is available in the Red Book.
- Found an issue? Let us know using JIRA our community issue tracker.
- Want to make a comment or ask a question about using HPCC Systems? Post in our community forum.
